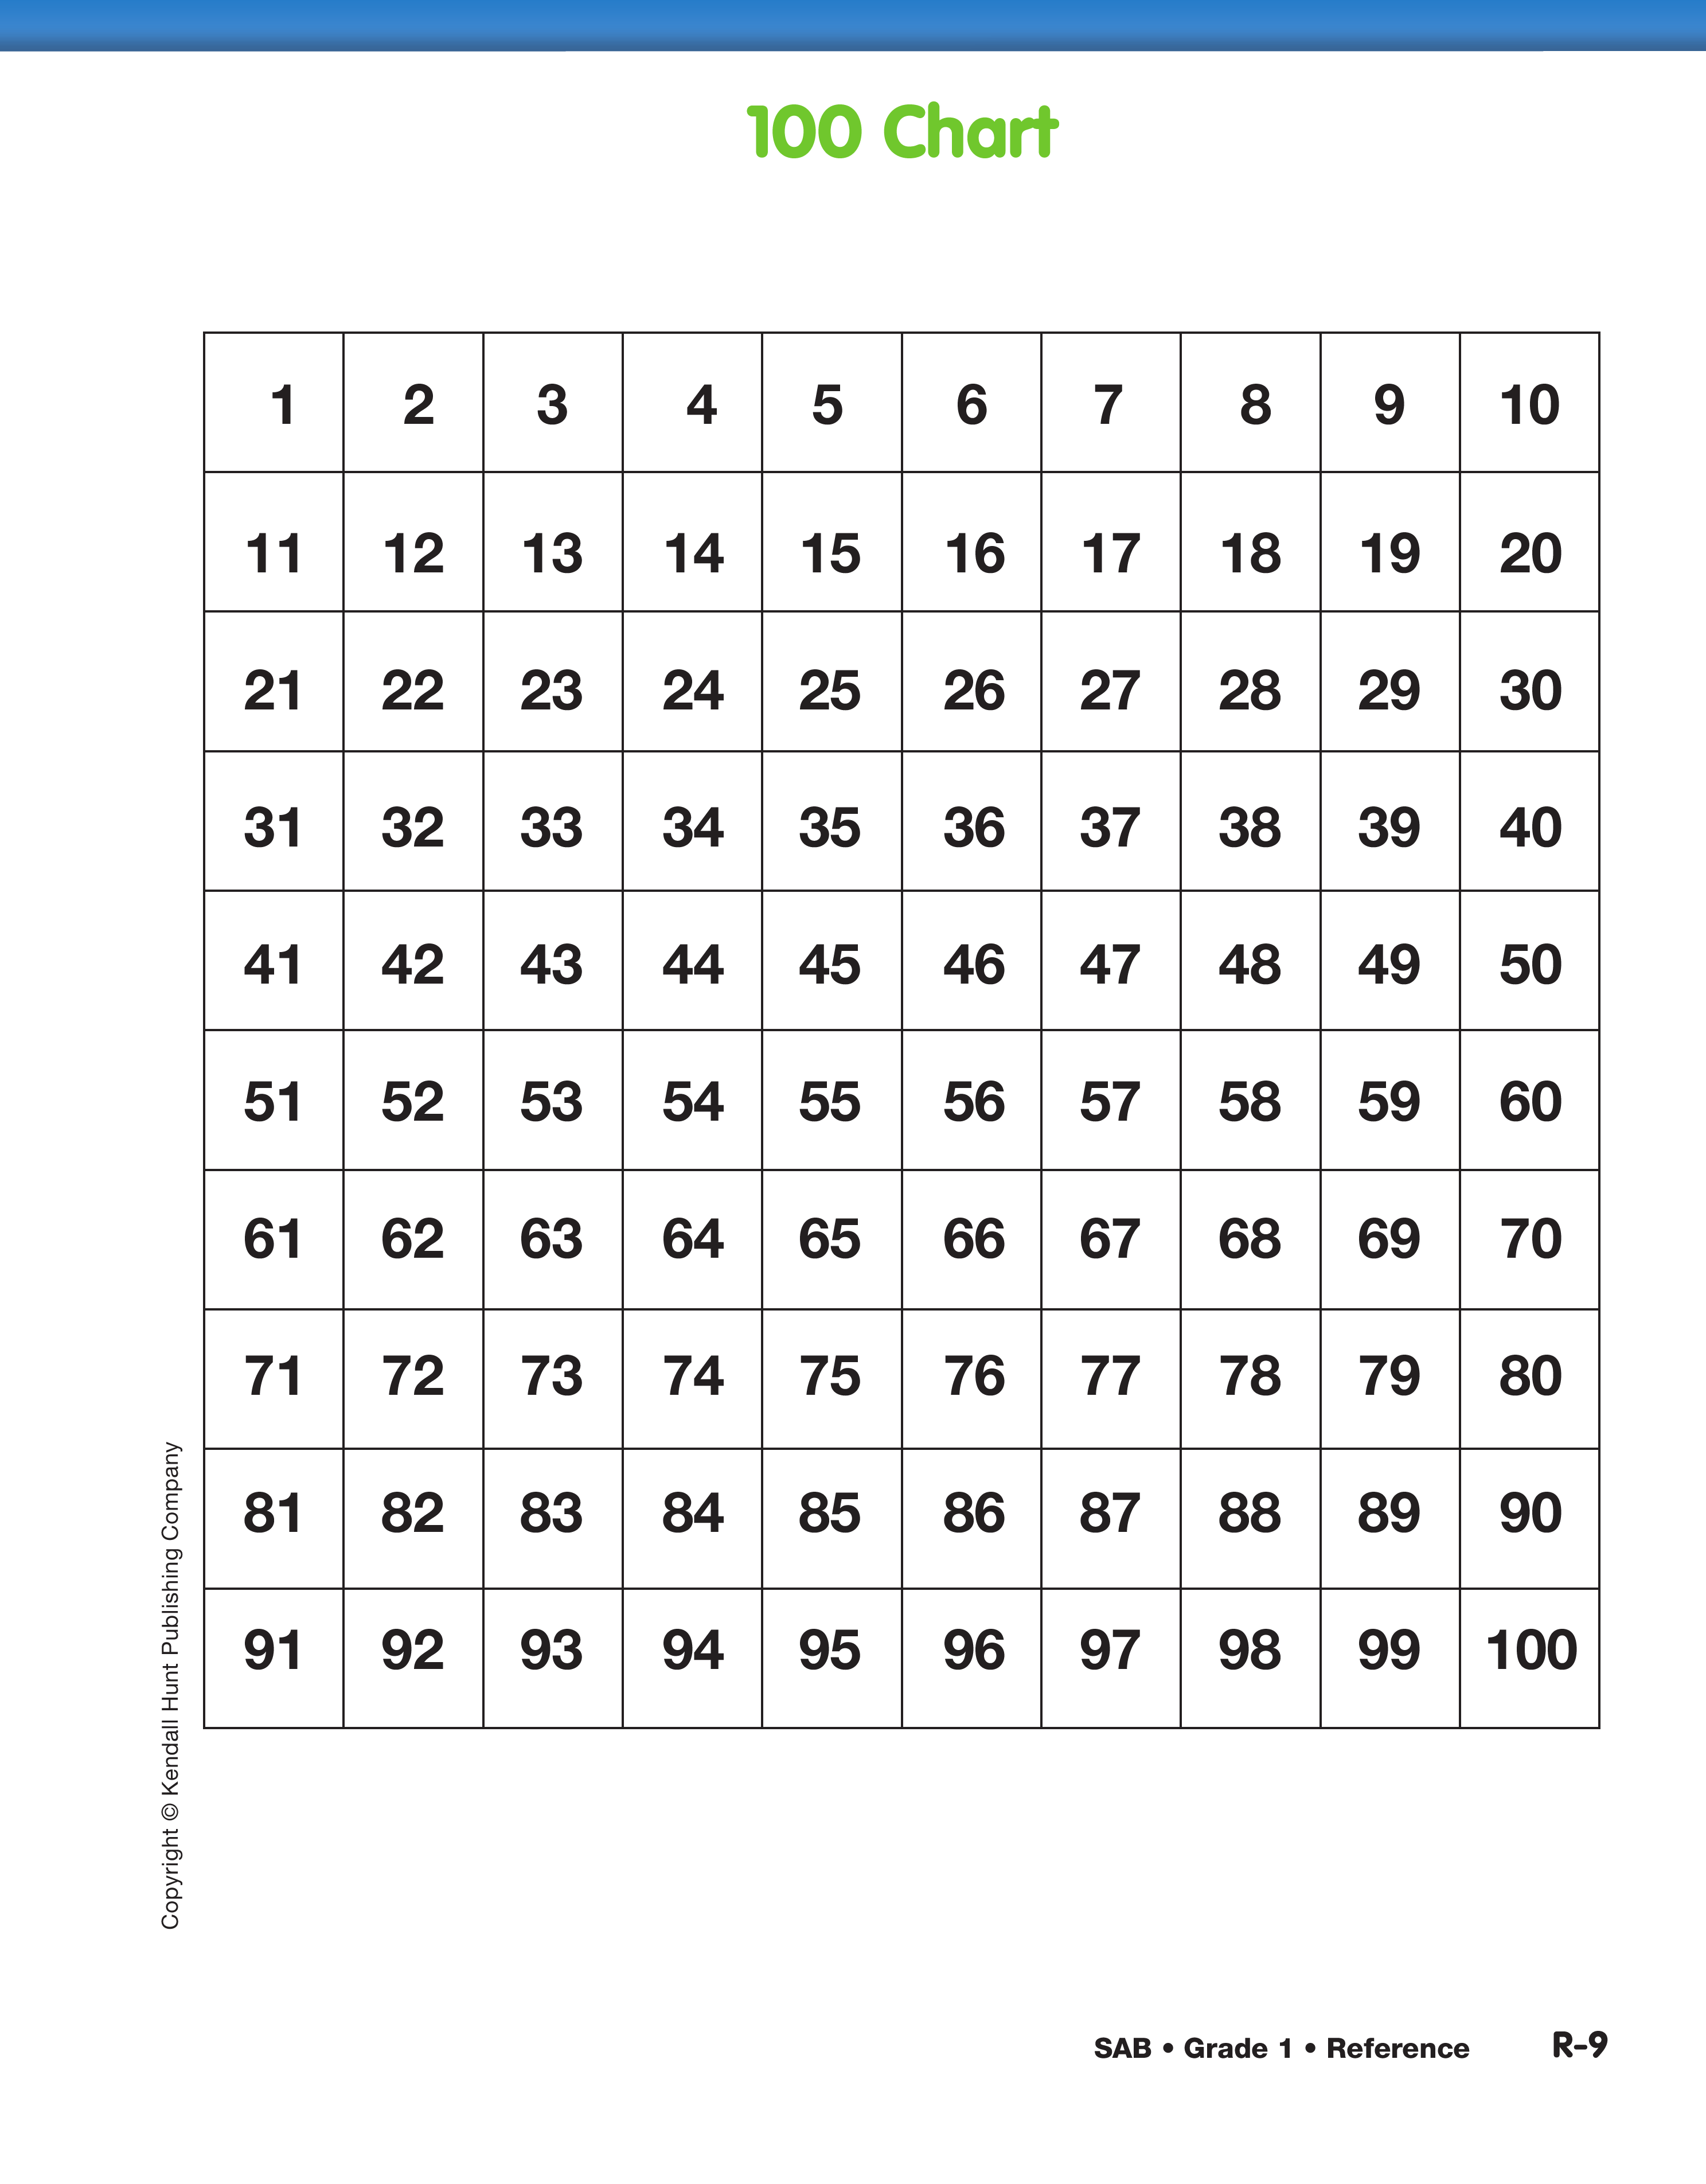
Review Patterns on the 100 Chart. Display and
direct students to the 100 Chart page from the
Student Activity Book Reference section. Remind students
that they used the 100 Chart in Unit 9 to skip
count and look for patterns. See Content Note.
When talking with students about the numbers on the
100 Chart, model language that emphasizes the relationship
among the numbers (i.e., ten more than, ten less than, one
more than, one less than, a lot more than, between 40 and 50).
When talking about the relative position of the numbers on the
chart, use language that emphasizes movement among rows
or across rows. Using language of "up" and "down" can be
confusing since moving in the "up" direction on the 100 Chart
results in numbers that decrease or go "down," and moving
"down" on the 100 Chart results in numbers that increase or
go "up." For example, it is clearer to say, "45 is ten more than
35. 45 is exactly one row below 35 on the chart." It may be
confusing to say, "45 is one down from 35."
Have the class skip count by fives until they reach
50. Place a single connecting cube on each of the
numbers as the students count aloud.
- Do you see a pattern when you skip count by
fives? What do you see? (Possible responses: I see
two columns going down. All the numbers in the
first column end in five. All the numbers in the
last column end in 0.)
Have the students skip count by tens in the same way.
Place a connecting cube on the numbers as the students
count aloud.
- Do you see a pattern when you skip count by tens?
(Possible responses: I see only one column now.
All the numbers end in zero.)
Ask students to skip count by tens again, this time
starting at 5.
- When you start at 5 and skip count by tens, what
do you notice? (Possible response: The numbers
going down all end in 5 and the other number
increases by one, like 15, 25, 35.)
- Start at 14 and skip count by tens. (14, 24, 34, etc.)
- What number is 10 more than 14? How do you
know? (24; Possible response: I just count on 10
more squares on the 100 Chart. I start at 15 and
count and move one square at a time to the right
across the rows and end on 24.)
- What number do you think is 10 more than 24?
Why do you think so? (34; Possible response: I
followed the same pattern. Each row on the chart
has 10. 34 is in the next row right below 24.)
Have students check their prediction by counting by
ones across the rows until they reach 34. Use a display
set of connecting cubes stacked in groups of ten
to verify. Ask students to make similar predictions
with another number that ends in four, such as 64.
Use the 100 Chart and connecting cubes to verify.
- How much more is 35 than 25? How much more is
75 than 65? (10)
- Ten more than 65 is 75. Where is 65 and where is 75 on the 100 Chart? (Possible response: 75 is right
below 65 in the next row.)
- What do you notice when you go exactly one row
below on the chart? (It increases a number by ten.)
- How many rows of ten are needed to reach 100?
Show how you know on the 100 Chart. (I can count
by tens on the chart: 10 rows of 10 make 100.)
Practice with other numbers going one row below or
above a number.
- What do you see when you look across the rows,
from left to right? (Possible response: All the numbers
increase by one. It's just like when you
count: 1, 2, 3 … 9.)
- How is that different from when you move exactly
one row below on the 100 Chart? (Moving across
the row, the numbers increase only by one and not
by tens like when you move one row below.)
Review what other observations students have about
the 100 Chart.
Target Numbers on the 100 Chart. Show students a
display of the Target Numbers Master. Explain that
the five square segments show a part of the
100 Chart. Write 25 in the center square in one of the
parts as shown in Figure 1. Show students that this is
their target number and that their task is to fill in the
missing numbers for each segment.
As students
answer the following questions, fill in the numbers
on the displayed master:
- What number is one less than 25? (24)
- What number is one more than 25? (26)
- What number is 10 less than 25? (15)
- What number is 10 more than 25? (35)
See Figure 2 for a completed puzzle.
Repeat this exercise using other numbers such as 12
and 38.
Have student volunteers fill in the numbers
on the display and explain their reasoning as you ask
questions similar to the following:
- How did you know what to put in this square?
- What happens as you move to the left of the target
number on the 100 Chart? (Possible response: The
number gets smaller. We are taking away or subtracting.)
- What happens as you move to the right of the target
number on the 100 Chart? (Possible response:
The number gets larger. We are adding.)
- What do you notice about the number in the row
directly above the target number? (Possible
responses: The number gets smaller. Its first digit
is one less but the second digit stays the same. We
subtract.)
- What do you notice about the number in the row
directly below the target number? (Possible
responses: The number gets larger. Its first digit is
one more but the second digit stays the same.)
Direct students to Questions A–E on the Practice
With Target Numbers pages in the Student Activity
Book. Explain that the five square segments show
parts of the 100 Chart, as if cut out of the 100 Chart.
The students are to fill in the missing numbers for
each segment. Invite them to share the results and
discuss any patterns they discover. For example, students
may say:
- The numbers above and below one another differ
by 10.
- Numbers to the right and left differ by one.
- Numbers above and below one another end in the
same number. (The ones digit is the same.)
- Numbers to the right and left of one another start
with the same number. (The tens digit is the
same.)
For additional practice, students will identify their
level of confidence with using the 100 Chart and
choose to work on either Questions F–K in the More
Target Numbers section or the more challenging
Questions L–R in the Tricky Target Numbers section
of the Practice with Target Numbers pages in the
Student Activity Book. Provide cubes and number
lines for additional support, if needed. Use your own
evaluation of students' progress to help guide their
choices. Monitor students' success level and use the
confidence levels flexibly. If students find a particular
group of problems too easy or too difficult, they
can simply choose other problems to complete.
Assign Check-In: Questions S–X on the Practice
with Target Numbers pages in the Student Activity
Book. Explain they are to fill in the boxes with the
missing numbers from the 100 Chart. They may use
their 100 Chart page from the Student Activity Book
Reference section to assist them if needed. They are
to circle any problems where they needed to use the
chart for help.
Use Check-In: Questions S–X on the Practice with Target
Numbers pages in the Student Activity Book to assess students'
abilities to represent and identify numbers to 100 using
the 100 Chart and symbols [E1].