


Spill the Beans
Est. Class Sessions: 2Developing the Lesson
Part 1: Group Beans to Count

Distribute blank paper and 40 to 70 beans to each student pair. See Materials Preparation. Ask each pair to count the number of beans in their pile. Ask students to record the number of beans counted on the scrap paper. Display the Spill the Beans Data Table Master and have each student pair report their total recording each in the fourth column, Number.
Ask students to explain how they counted their beans and what problems they had, if any, in counting them. Most students will have counted by ones, although a few pairs may have grouped and counted by twos, fives, or tens. It is expected that some pairs will have had problems organizing and counting the beans. Ask students whether their counting experiences were easy or difficult and why.
If no students used the strategy of counting by tens, remind the class of previous experiences in which they grouped and counted by tens (for example, Unit 5 Grouping and Counting). Point to 38 on the number line. Have students count up to 30 by tens, then count on by ones. If some students used this strategy for counting their beans, encourage them to discuss how it was helpful. Have those students demonstrate how they counted by tens to count their beans. Then have the rest of the class use the number line to count aloud by tens and leftover ones to the same number.
Lead a discussion comparing counting by twos and fives to counting by tens and leftover ones. Begin by displaying a collection of beans.
Using 43 beans, for example, ask questions similar to the following:

Move beans into groups of five with three left over.
Move the beans into groups of ten with three ones left over.
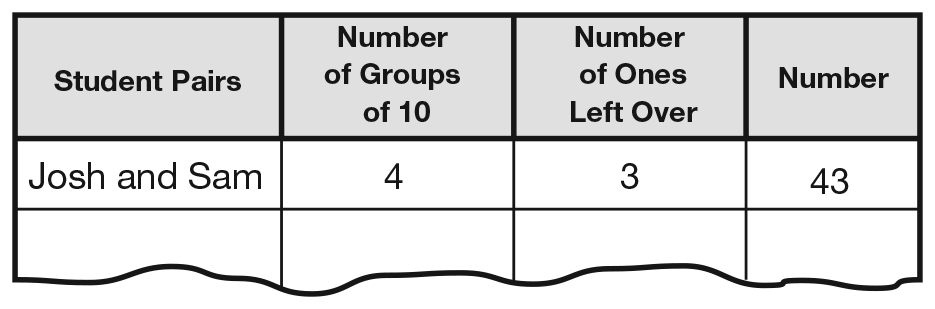
Follow up the discussion by asking all pairs to go back to their beans and group them by tens. Have each pair report the total number of groups of ten and the number of ones left over. Record their answers on the display of the Spill the Beans Data Table as shown in Figure 1.
Use a 100 Chart to Group and Count. Display the 100 Chart and have students look at the 100 Chart page from the Reference section of the Student Activity Book. Ask them to find their individual totals on the 100 Chart.
Ask:
Using one student's total, (i.e., 43), ask how many groups of ten are in 43 and how many ones are left over. At the same time show on the display that it is also 4 complete rows on the 100 Chart with 3 more in the next row. To underscore the connection, have other students come to the display and use their totals to say aloud the same connections between the groups of tens with leftover ones and the full rows of ten with a partial row on the 100 Chart.
Ask each student pair questions similar to the following:
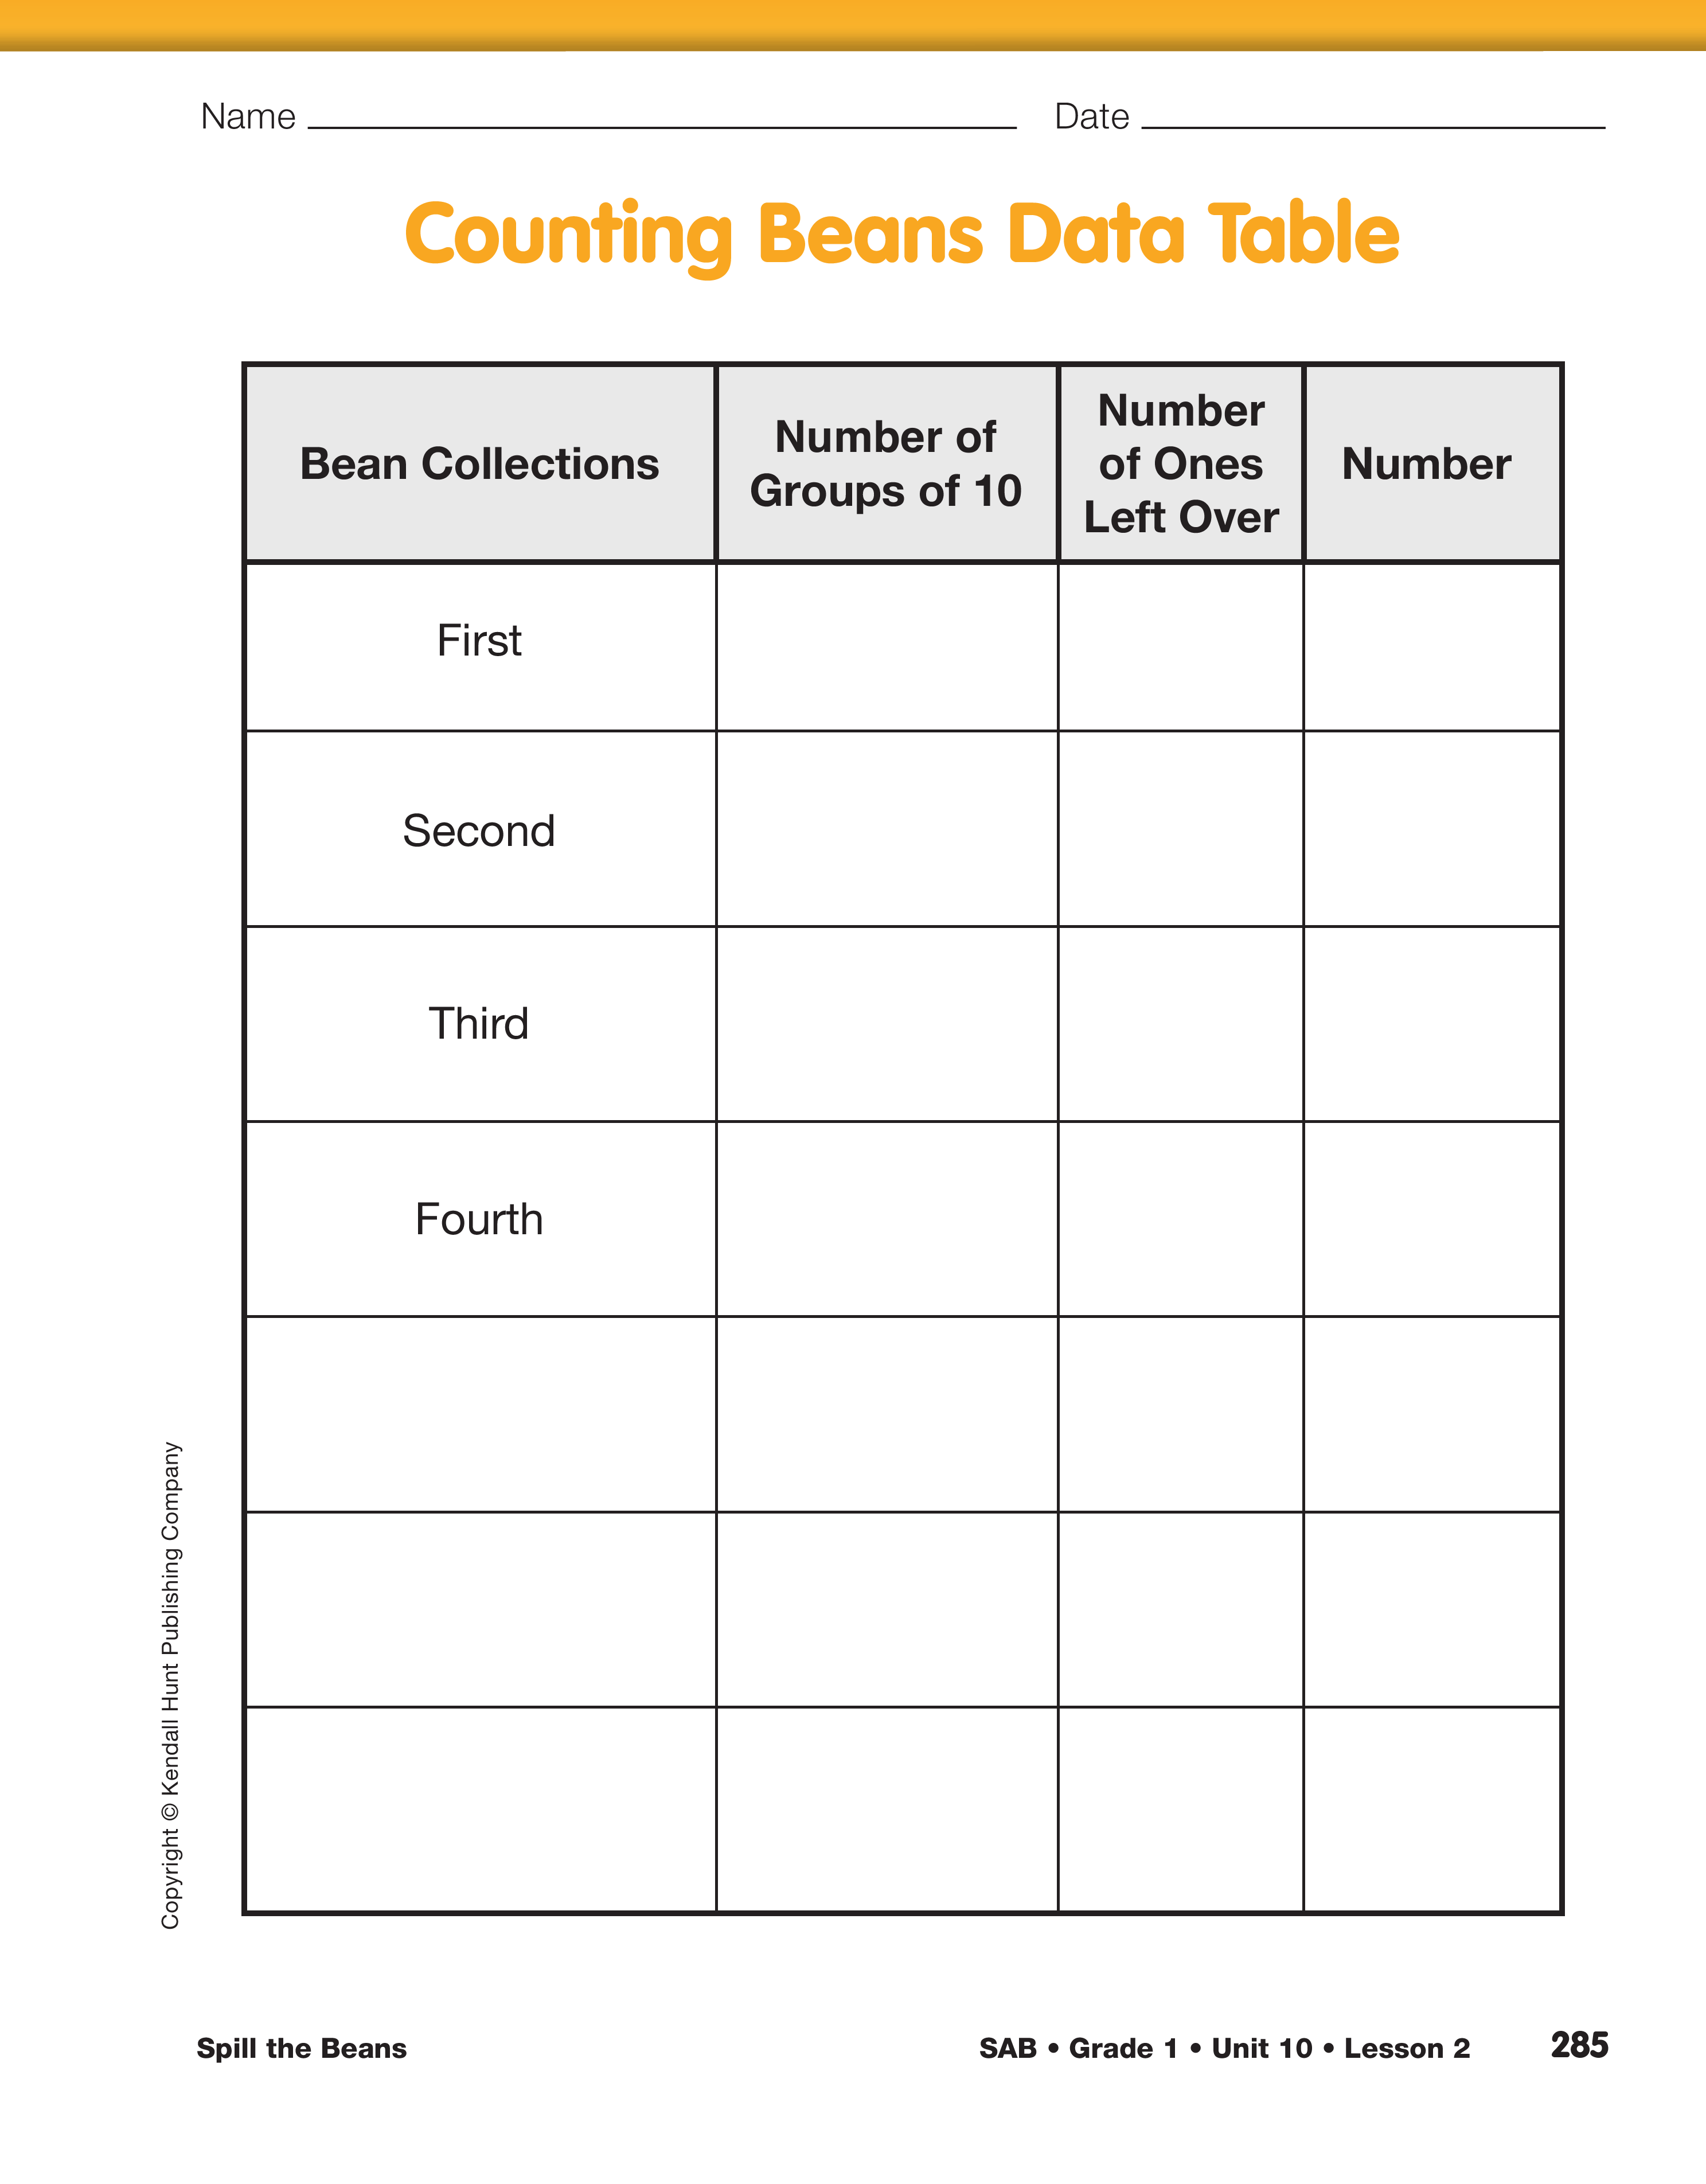
Have each pair of students count several collections of beans as time allows and record the results on their Counting Beans Data Table, then locate each total on their 100 Chart. If students are slow to grasp the grouping concept, they will have several additional experiences in this and later units to reinforce the connection between grouping, names, and location on the 100 Chart.
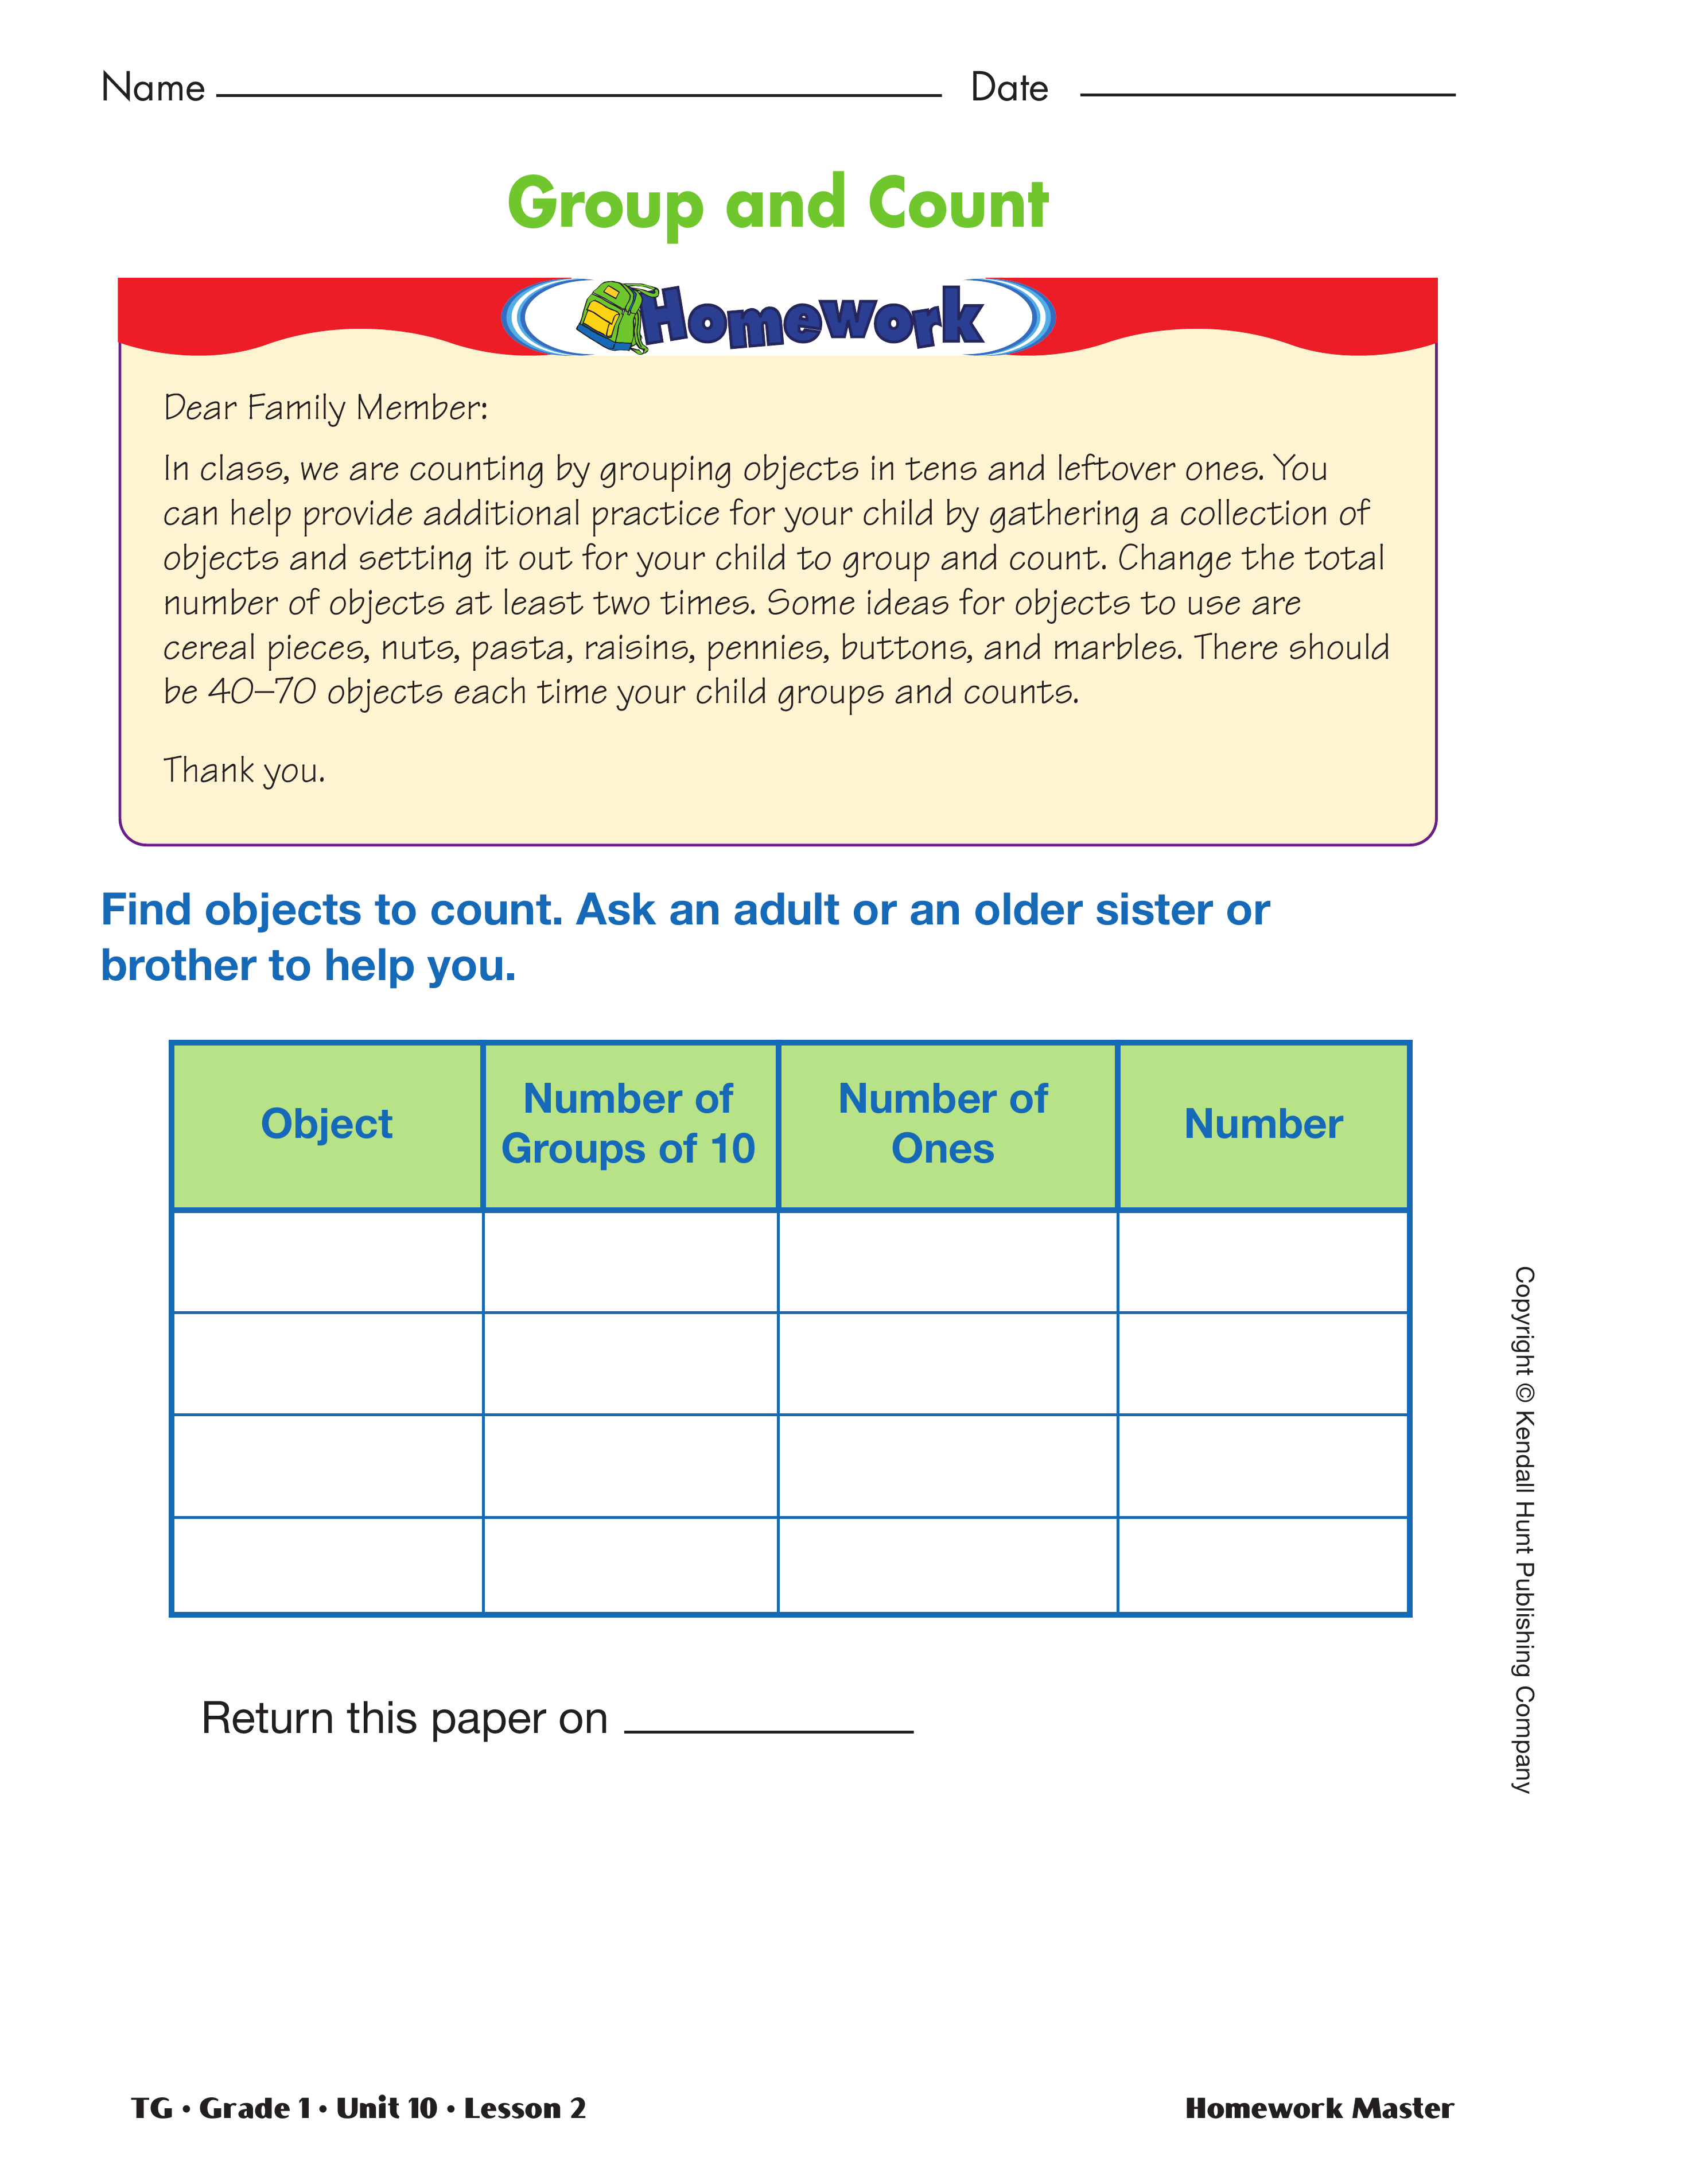
Assign the Group and Count Homework Master. Discuss students' counting experiences when they return their homework. Invite them to tell what they counted and to share problems or successes they had.