


Full of Beans
Est. Class Sessions: 3
Students build ideas about volume and compare relative sizes of units by measuring containers with beans. Students group and count beans by tens and ones and then pool their data to graph the middle, or median, number of beans to compare the quantities.
Content in this Lesson
- Grouping and counting objects by tens and ones and naming the number of objects [E2].
- Representing and identifying numbers to 100 [E1].
- Exploring volume measurement (capacity) [E5].
- Collecting and organizing information in a data table [E6].
- Making bar graphs [E7].
- Exploring the inverse relationship between the unit's size and the number of units needed to measure a container's volume [E4].
- Comparing quantities [E3].
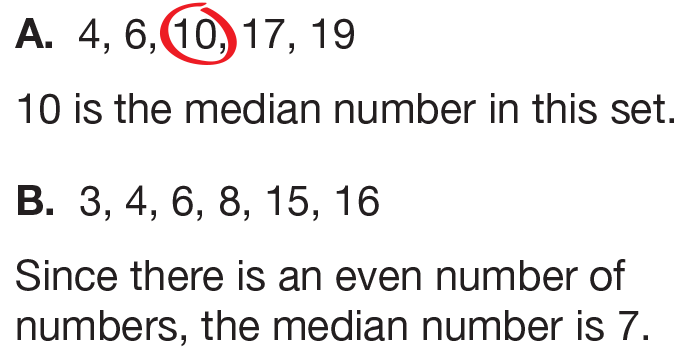
- Finding the median of a data set.
- Using data to solve problems involving volume [E8].
- Checking the reasonableness of measurements by comparing data [MPE3].
- Communicating mathematics verbally and in writing [MPE5].
Daily Practice and Problems S–X

Materials for Students
| Daily Practice and Problems | Lesson | Homework | Assessment | ||
|---|---|---|---|---|---|
Student Book |
Student Activity Book |
|
|
|
|
Teacher Resources |
Teacher Guide - digital |
|
Supplies for Student Pairs
2 two-ounce cups
enough large beans to fill a two-ounce cup (approximately 40 beans)
enough small beans to fill a two-ounce cup (approximately 80 beans)
modified egg carton (optional). See Materials Preparation.
2 self-adhesive notes
Materials for the Teacher
Display of Ten Frames Master (Teacher Guide)
Display of Graph section of Full of Beans pages (Student Activity Book) Page 307
Unit 10 Assessment Record
Math Facts Class Record
Unit 10 Individual Assessment Record
2 pounds each of small beans and large beans. See Material Preparations.
2 large containers for the beans
class number line (0–130)
Materials Preparation
Organize Beans. Gather a 2-pound bag of a small bean (e.g., kidney) and a 2-pound bag of a large bean (e.g., lima). Empty both bags into separate large containers and place them in a central location.
Prepare Ten Frames or Egg Cartons. Student pairs can use the Ten Frames Master to arrange their beans into groups of tens and ones. As an alternative, modify one egg carton for each group. Cut and staple them as shown in Figure 1 so they have ten sections instead of twelve. Instead of simply cutting off the end, cut each carton in the middle and staple the two parts so they overlap to create an enclosed container that won't leak beans. Nest cup 5 into cup 4.
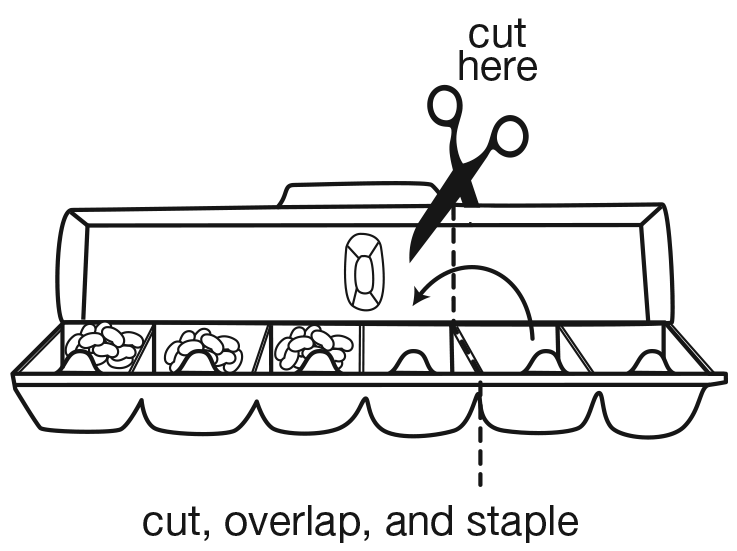
Figure 1: Modifying an egg carton from 12 to 10 cups
Assessment in this Lesson
| Assessment | Expectation Assessed | Math Practices Expectation Assessed |
|---|---|---|
|
Full of Beans Data Tables Student Activity Book Page 306 |
|
|
|
Full of Beans Bar Graph Student Activity Book Page 307 |
|
|
|
Full of Beans Check-In: Questions 1–4 with Feedback Box Student Activity Book Pages 309–310 |
|
|
|
Counting Beans Student Activity Book Pages 311–312 |
|
|
|
DPP Item T Math Facts Check Teacher Guide - digital |
|
|
|
DPP Item V Box Diagrams Teacher Guide - digital |
|
|
|
DPP Item X Fact Families: Group C Teacher Guide - digital |
|