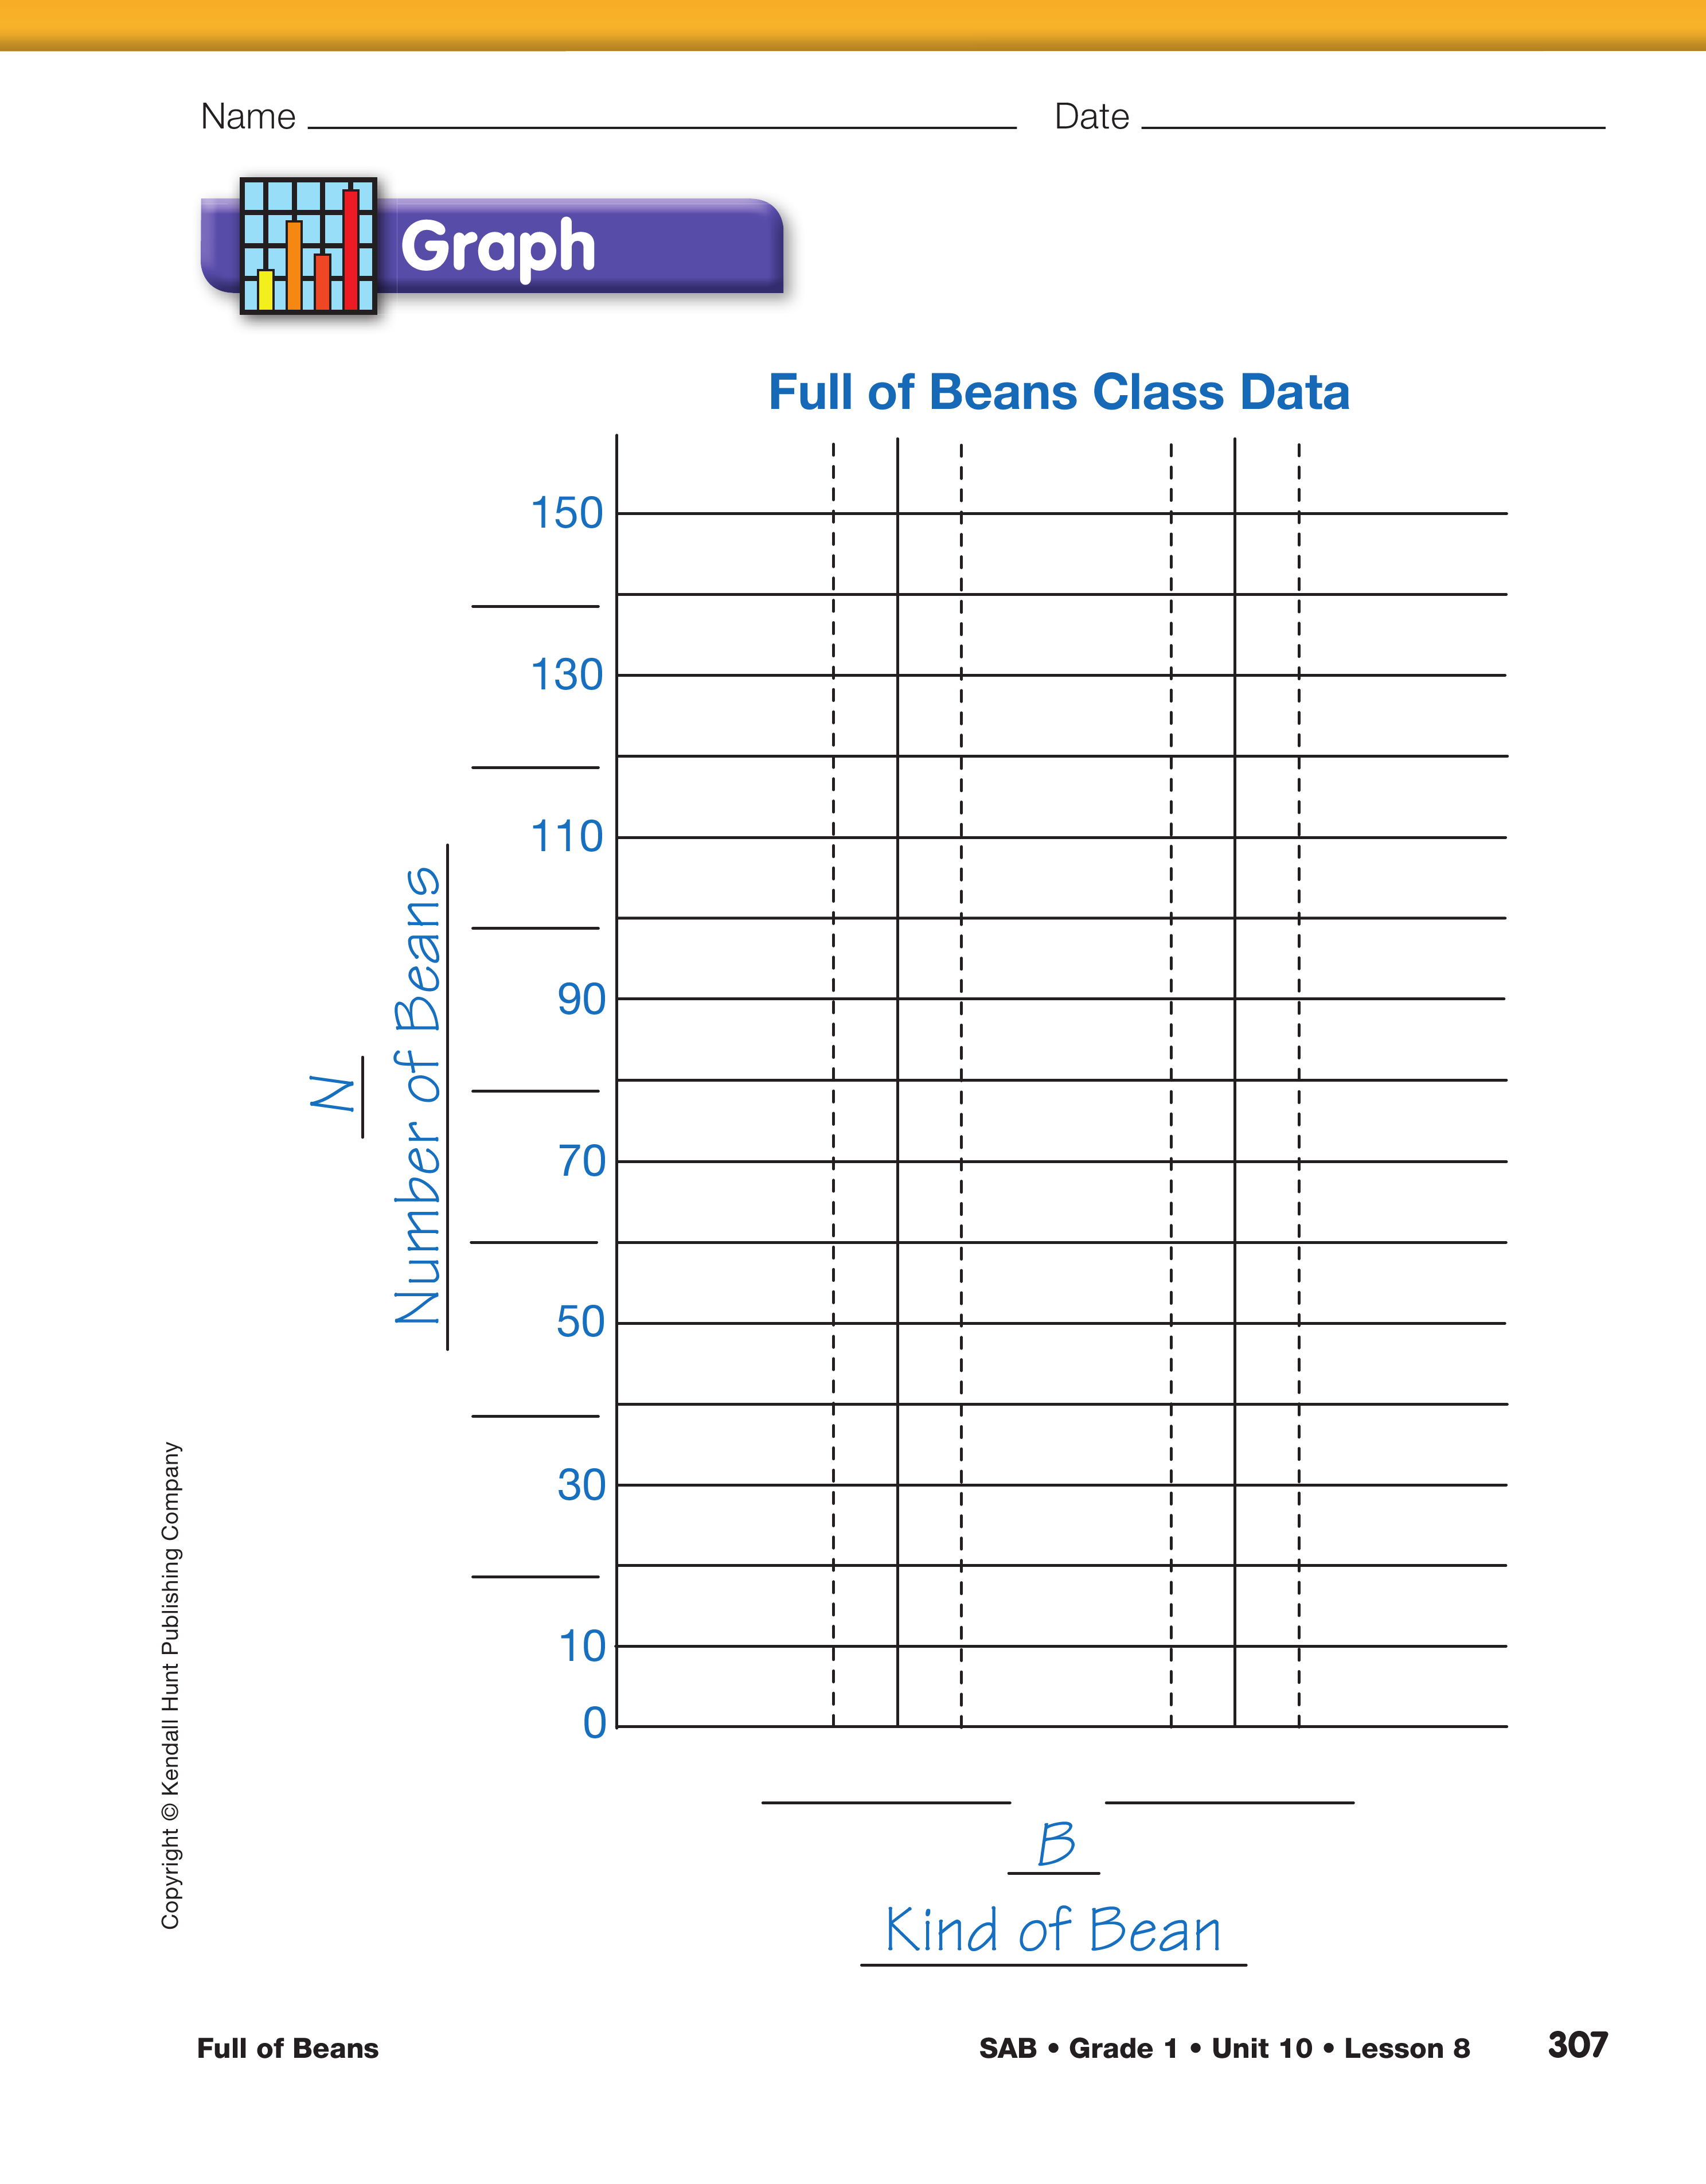
Make a Bar Graph. Explain to students that they are
going to show the class data on a bar graph. Display
the Graph section from the Full of Beans pages.
- What do the numbers on the vertical axis of the
graph represent? (number of beans)
- What are the 2 columns on the horizontal axis for?
(two kinds of beans)
Work with students to fill in the missing numbers on
the vertical axis and write (or draw) the two kinds of
beans on the horizontal axis. If your students can do it
on their own, have them graph the class data independently;
otherwise, demonstrate how to fill in the bar
for one kind of bean; then, have students complete the
other bar independently.
Use the graph on the Full of Beans pages in the Student
Activity Book to assess students' abilities to make a bar
graph [E7].
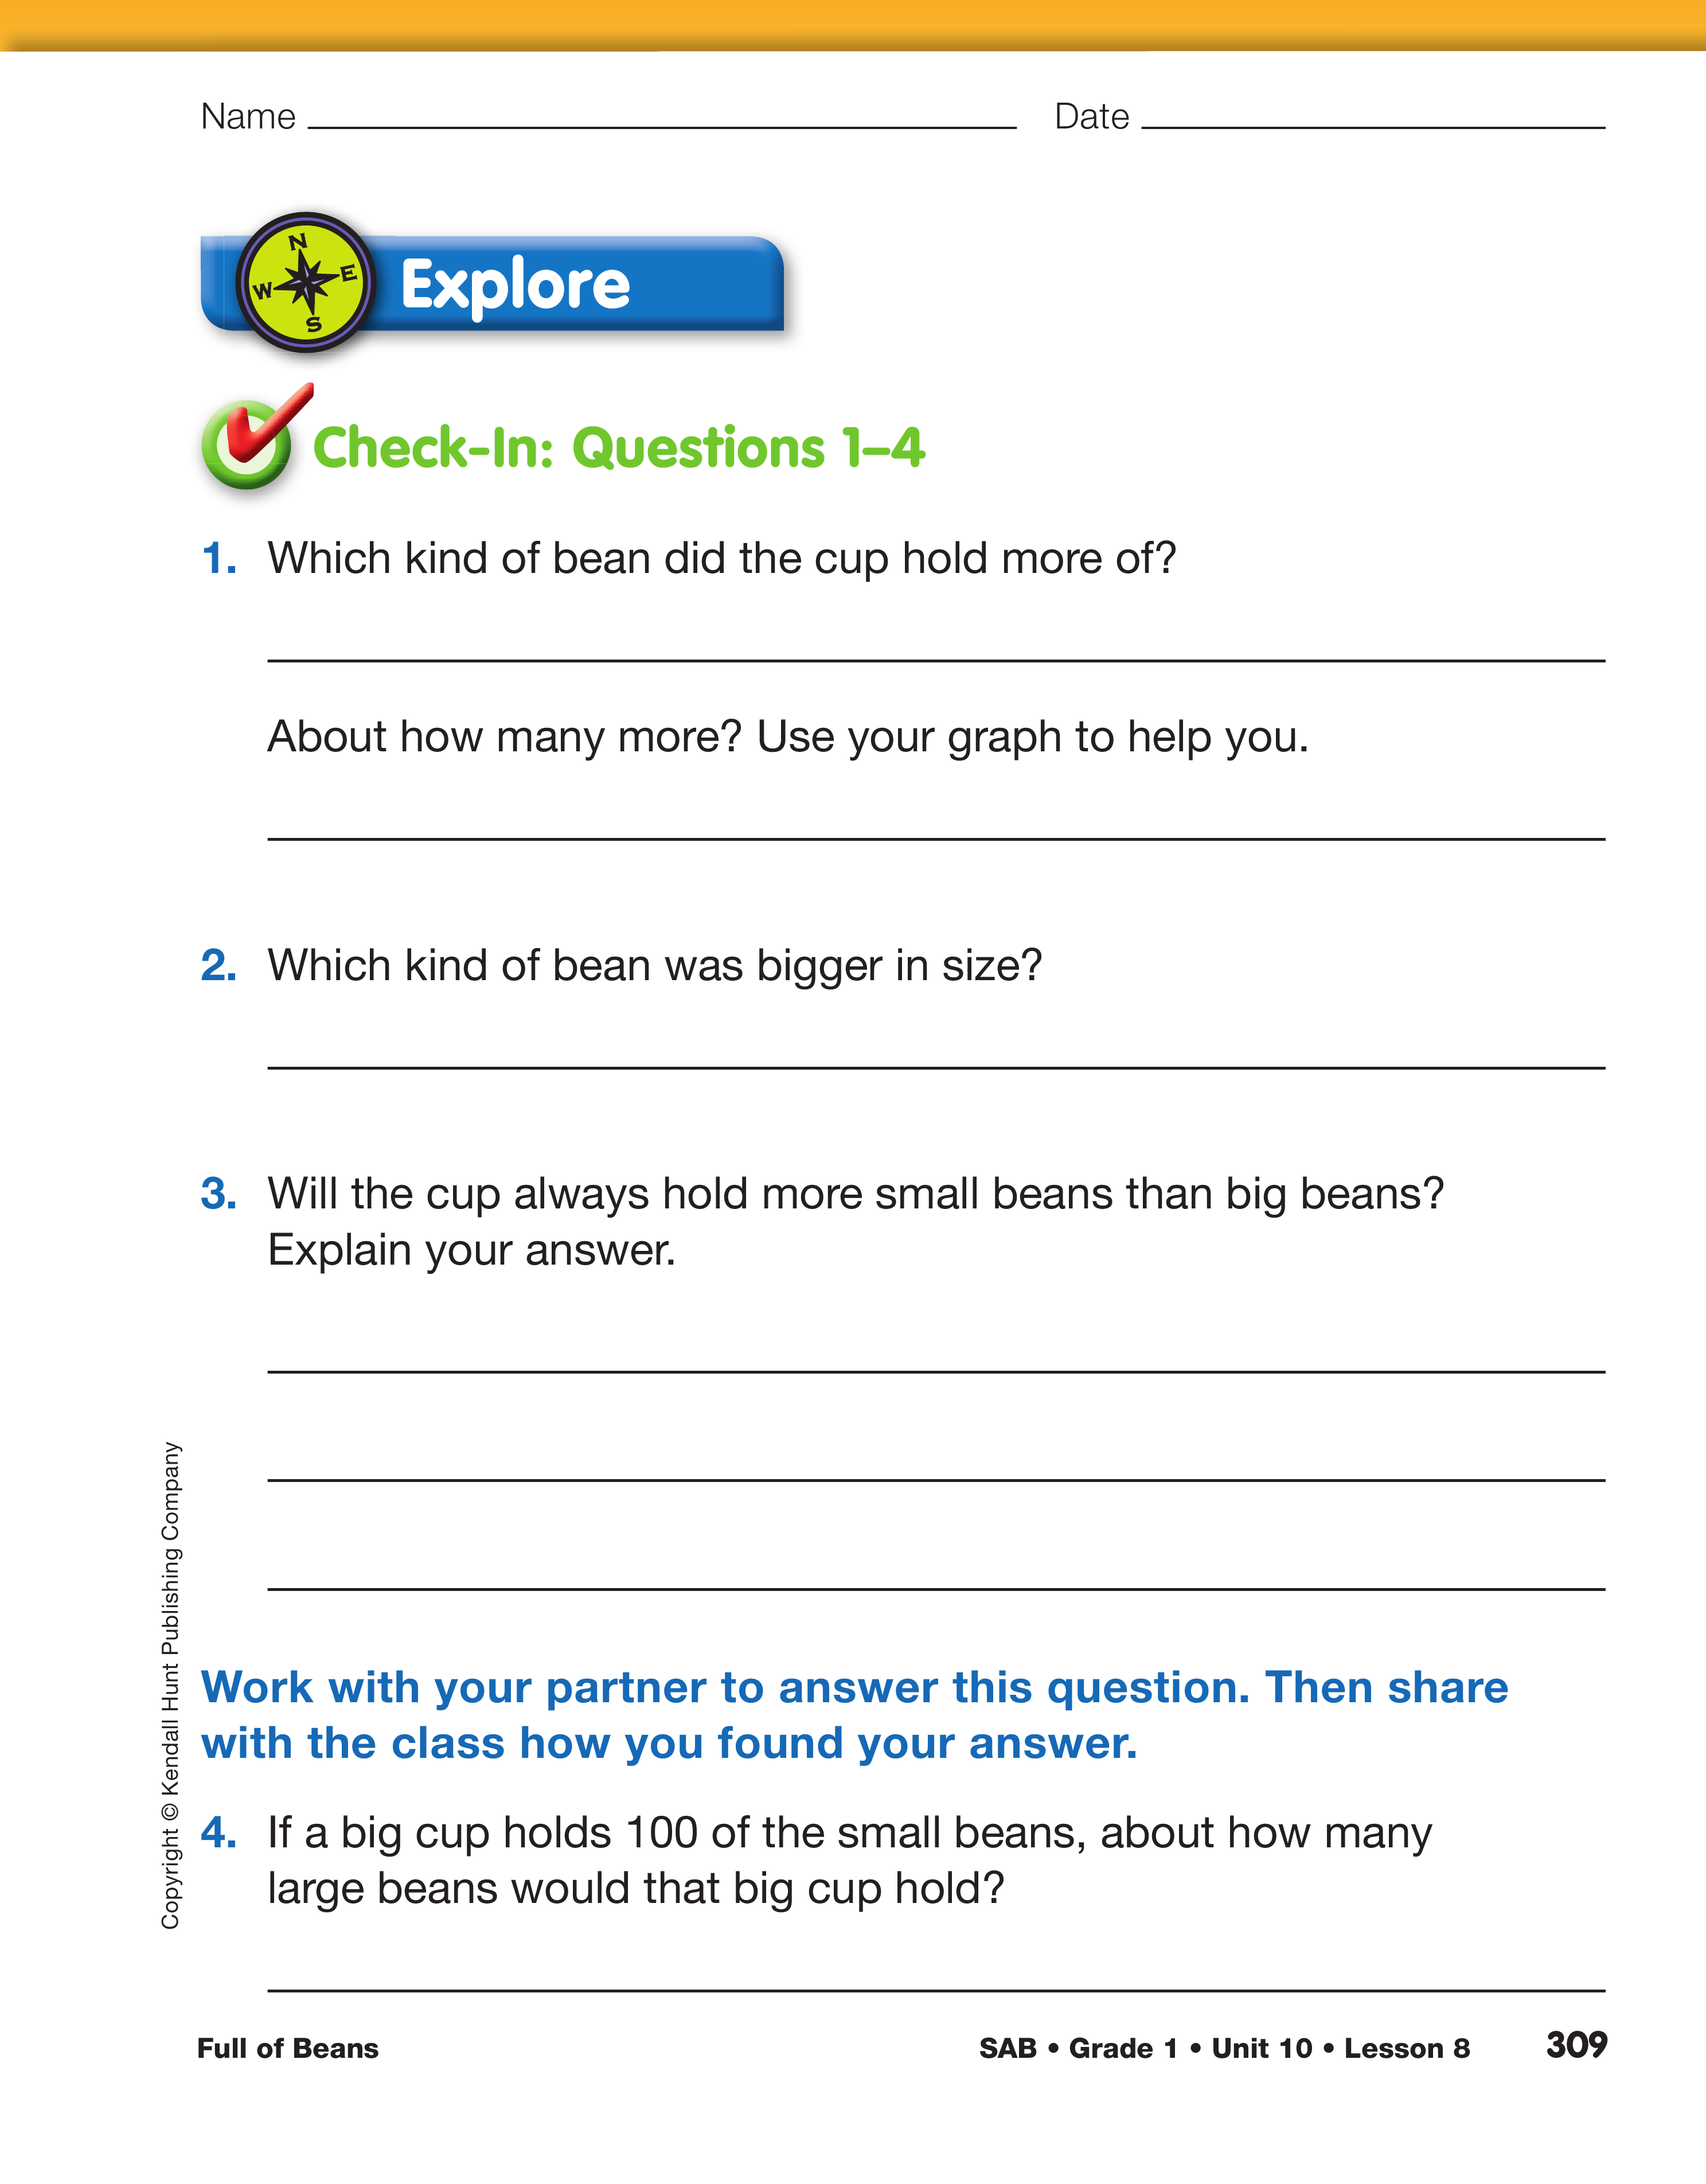
Analyze Data. Conclude by having students revisit
the major concepts of the lab by completing the questions
in the Explore section of the Full of Beans
pages. The questions focus on the idea that more of
the smaller beans are required to fill the cup than the
larger beans.
Before students begin working on the
questions, ask:
- Look at your graph. What do you notice? (Possible
response: The bar for the smaller bean is taller
than the bar for the larger bean.)
Assign Check-In: Questions 1–4 to student pairs.
When students are done, use the questions to guide a
class discussion.
- Look at your graphs again. Why is the bar for the
smaller bean taller than the one for the larger bean?
What do you think that means? (Possible response:
I could fit more of the small beans in the cup than
the large beans. It took more small beans to fill a
cup than large beans.)
- How did you use your graph to find out how many
more small beans fit inside a cup than large beans?
(Possible response: I started at the top of the large
bean bar on the graph and counted up by tens and
leftover ones to the top of the small bean bar to
find out how many more.)
- Will a cup always hold more small beans than big
beans? Explain. (Possible response: Yes, if the cup
is the same size, it will always hold more small
beans than large beans because every large bean
takes up more space than each small bean. You
cannot fit as many large beans in the cup as small
beans.)
- You are asked to make a prediction in Question 4: If
you had a cup that holds 100 small beans, about
how many large beans would the cup hold?
(Predictions will vary based on sizes of the beans.
Possible response: I think the cup can hold
50 large beans because two small beans are about
the same size as one large bean.)
- How did you make your prediction? (Answers will
vary based on sizes of the beans. Possible
response: I knew it would be less of the large
beans. I looked at my bar graph. I could fit about
two of the large bean bars on the graph onto the
small bean bar on the graph so I divided the 100 small
beans in two to get 50 large beans.)
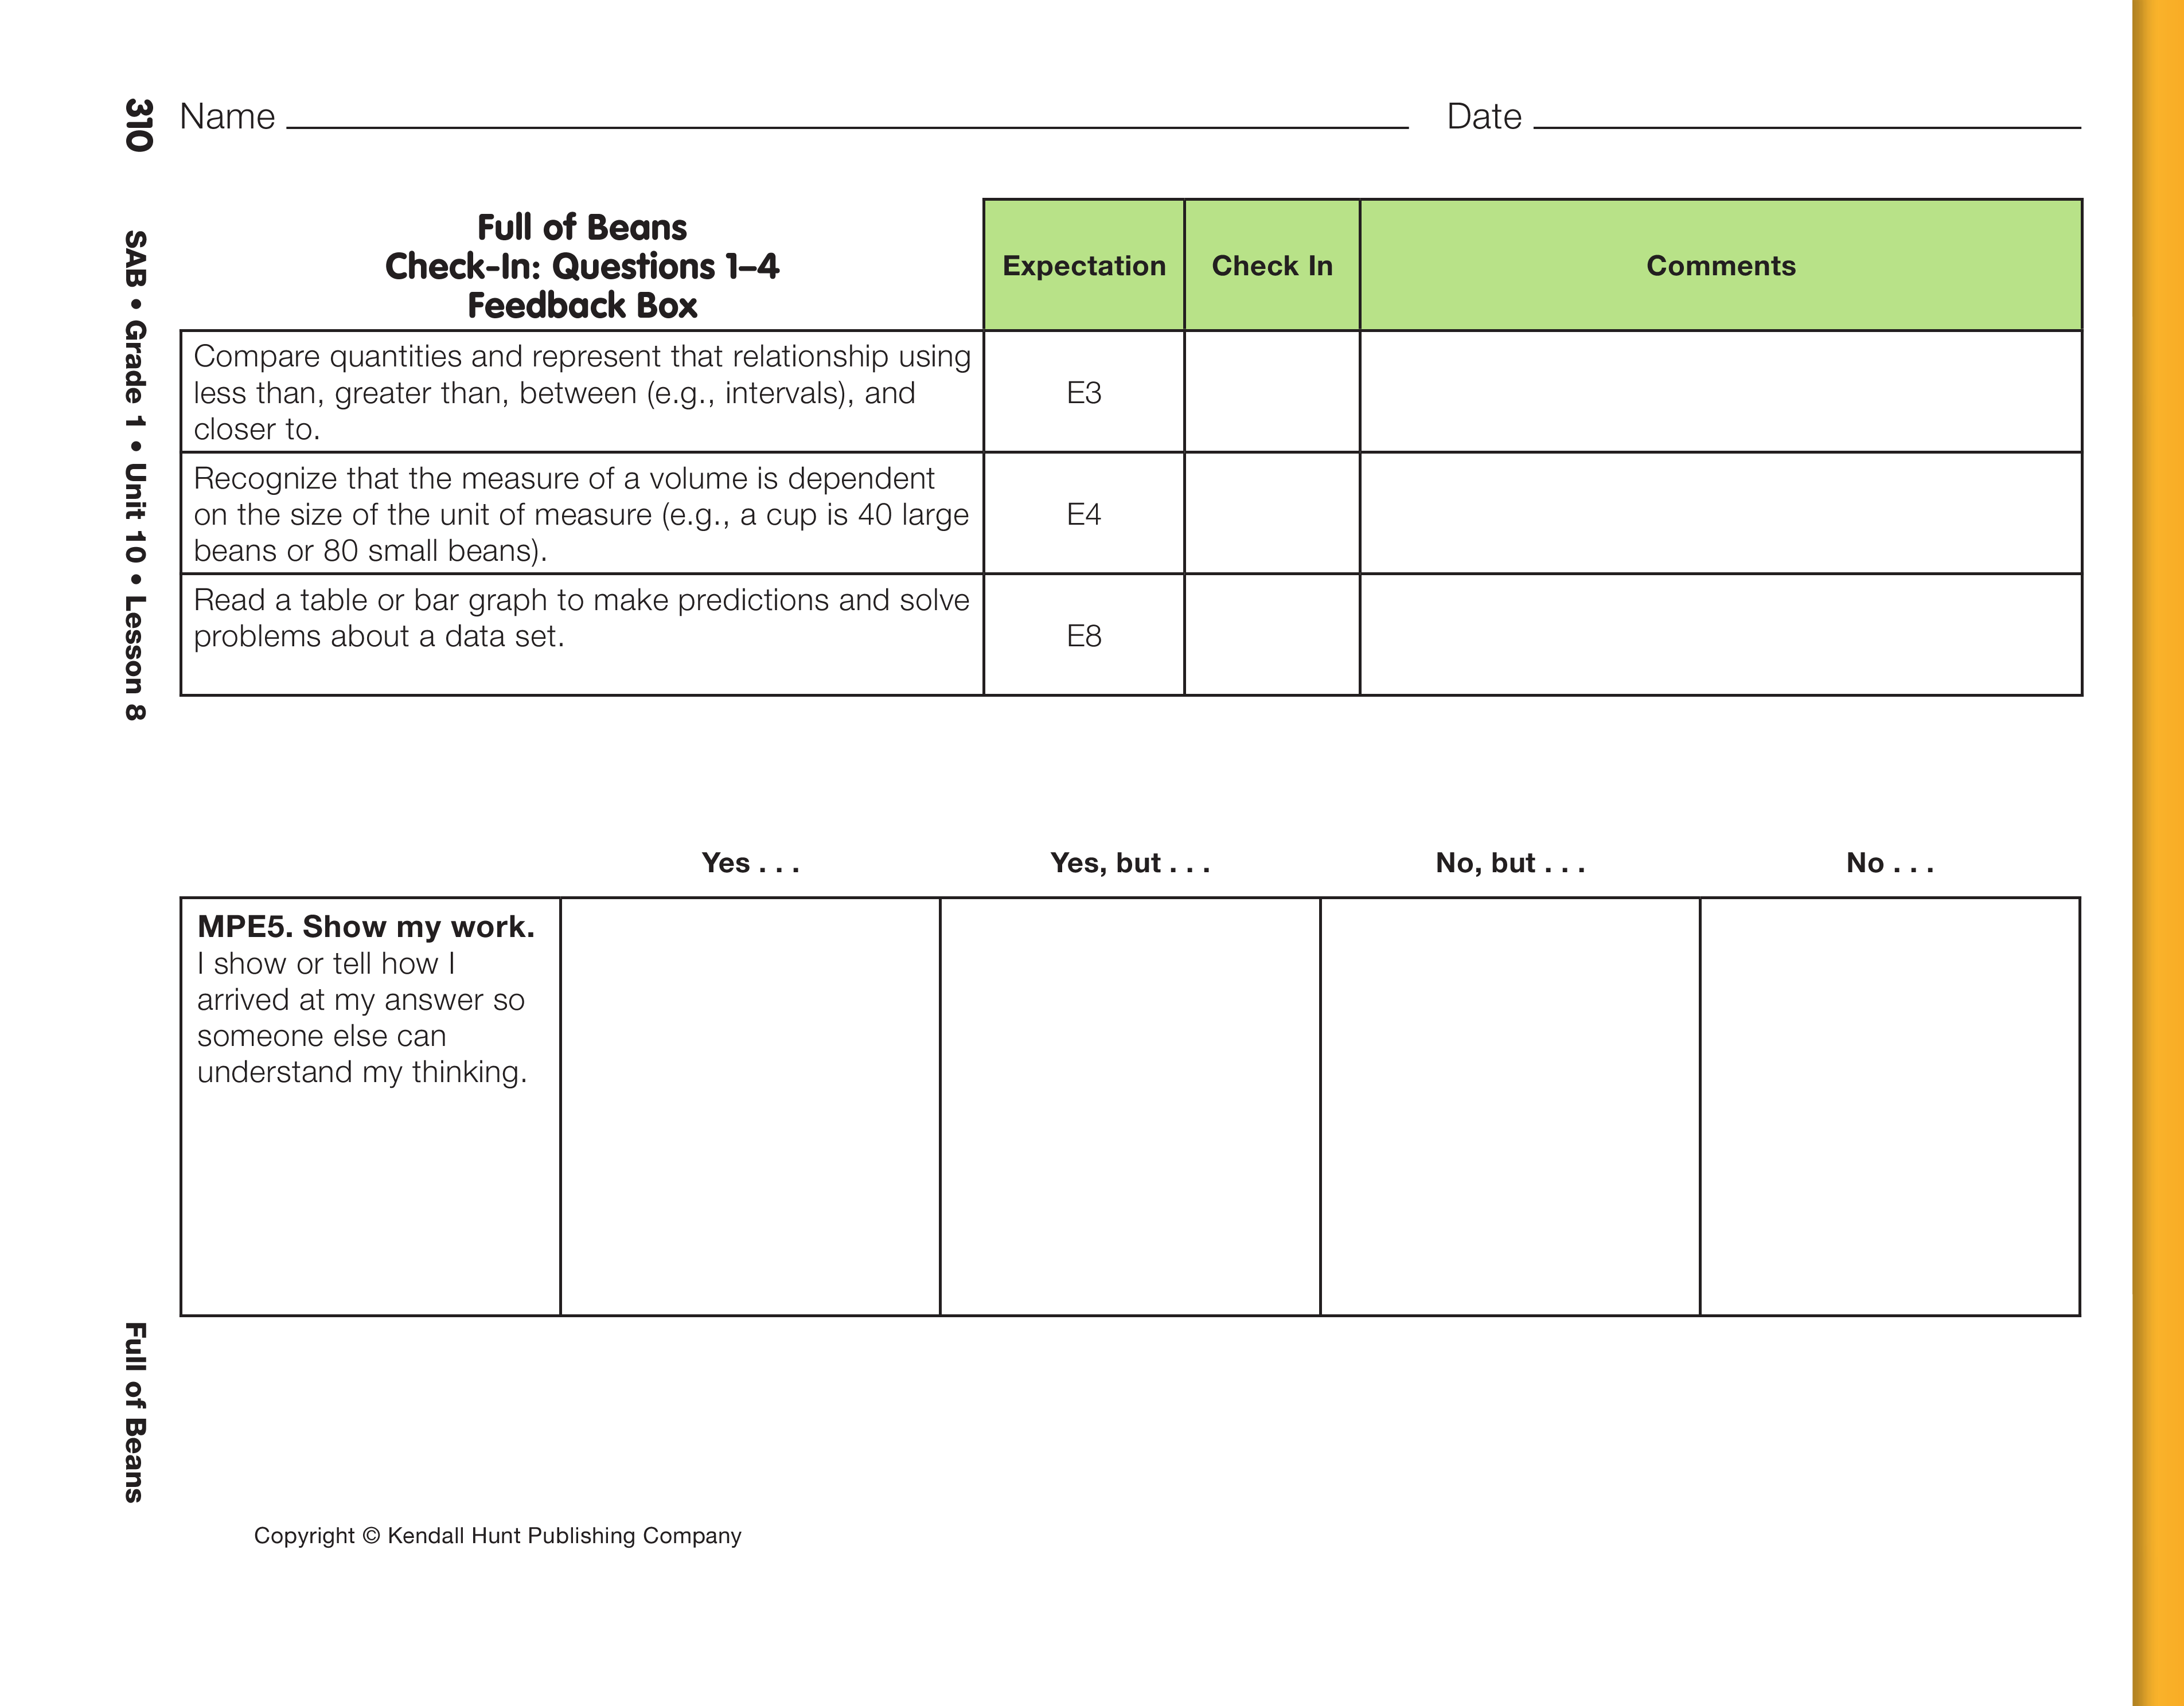
Question 4 can help you assess whether they understand
the key volume idea associated with the lab—that fewer large beans would be required. It also can
give you an idea of students' perception of the relative
size of large numbers.
Use Check-In: Questions 1–4 on the Full of Beans pages with
the Feedback Box in the Student Activity Book to assess students'
abilities to read a table or bar graph to make predictions
and solve problems about a data set [E8]; compare
quantities [E3]; recognize that the measure of a volume is
dependent on the size of the unit of measure [E4]; and
explain their work [MPE5].