


Fill It Up
Est. Class Sessions: 3Developing the Lesson
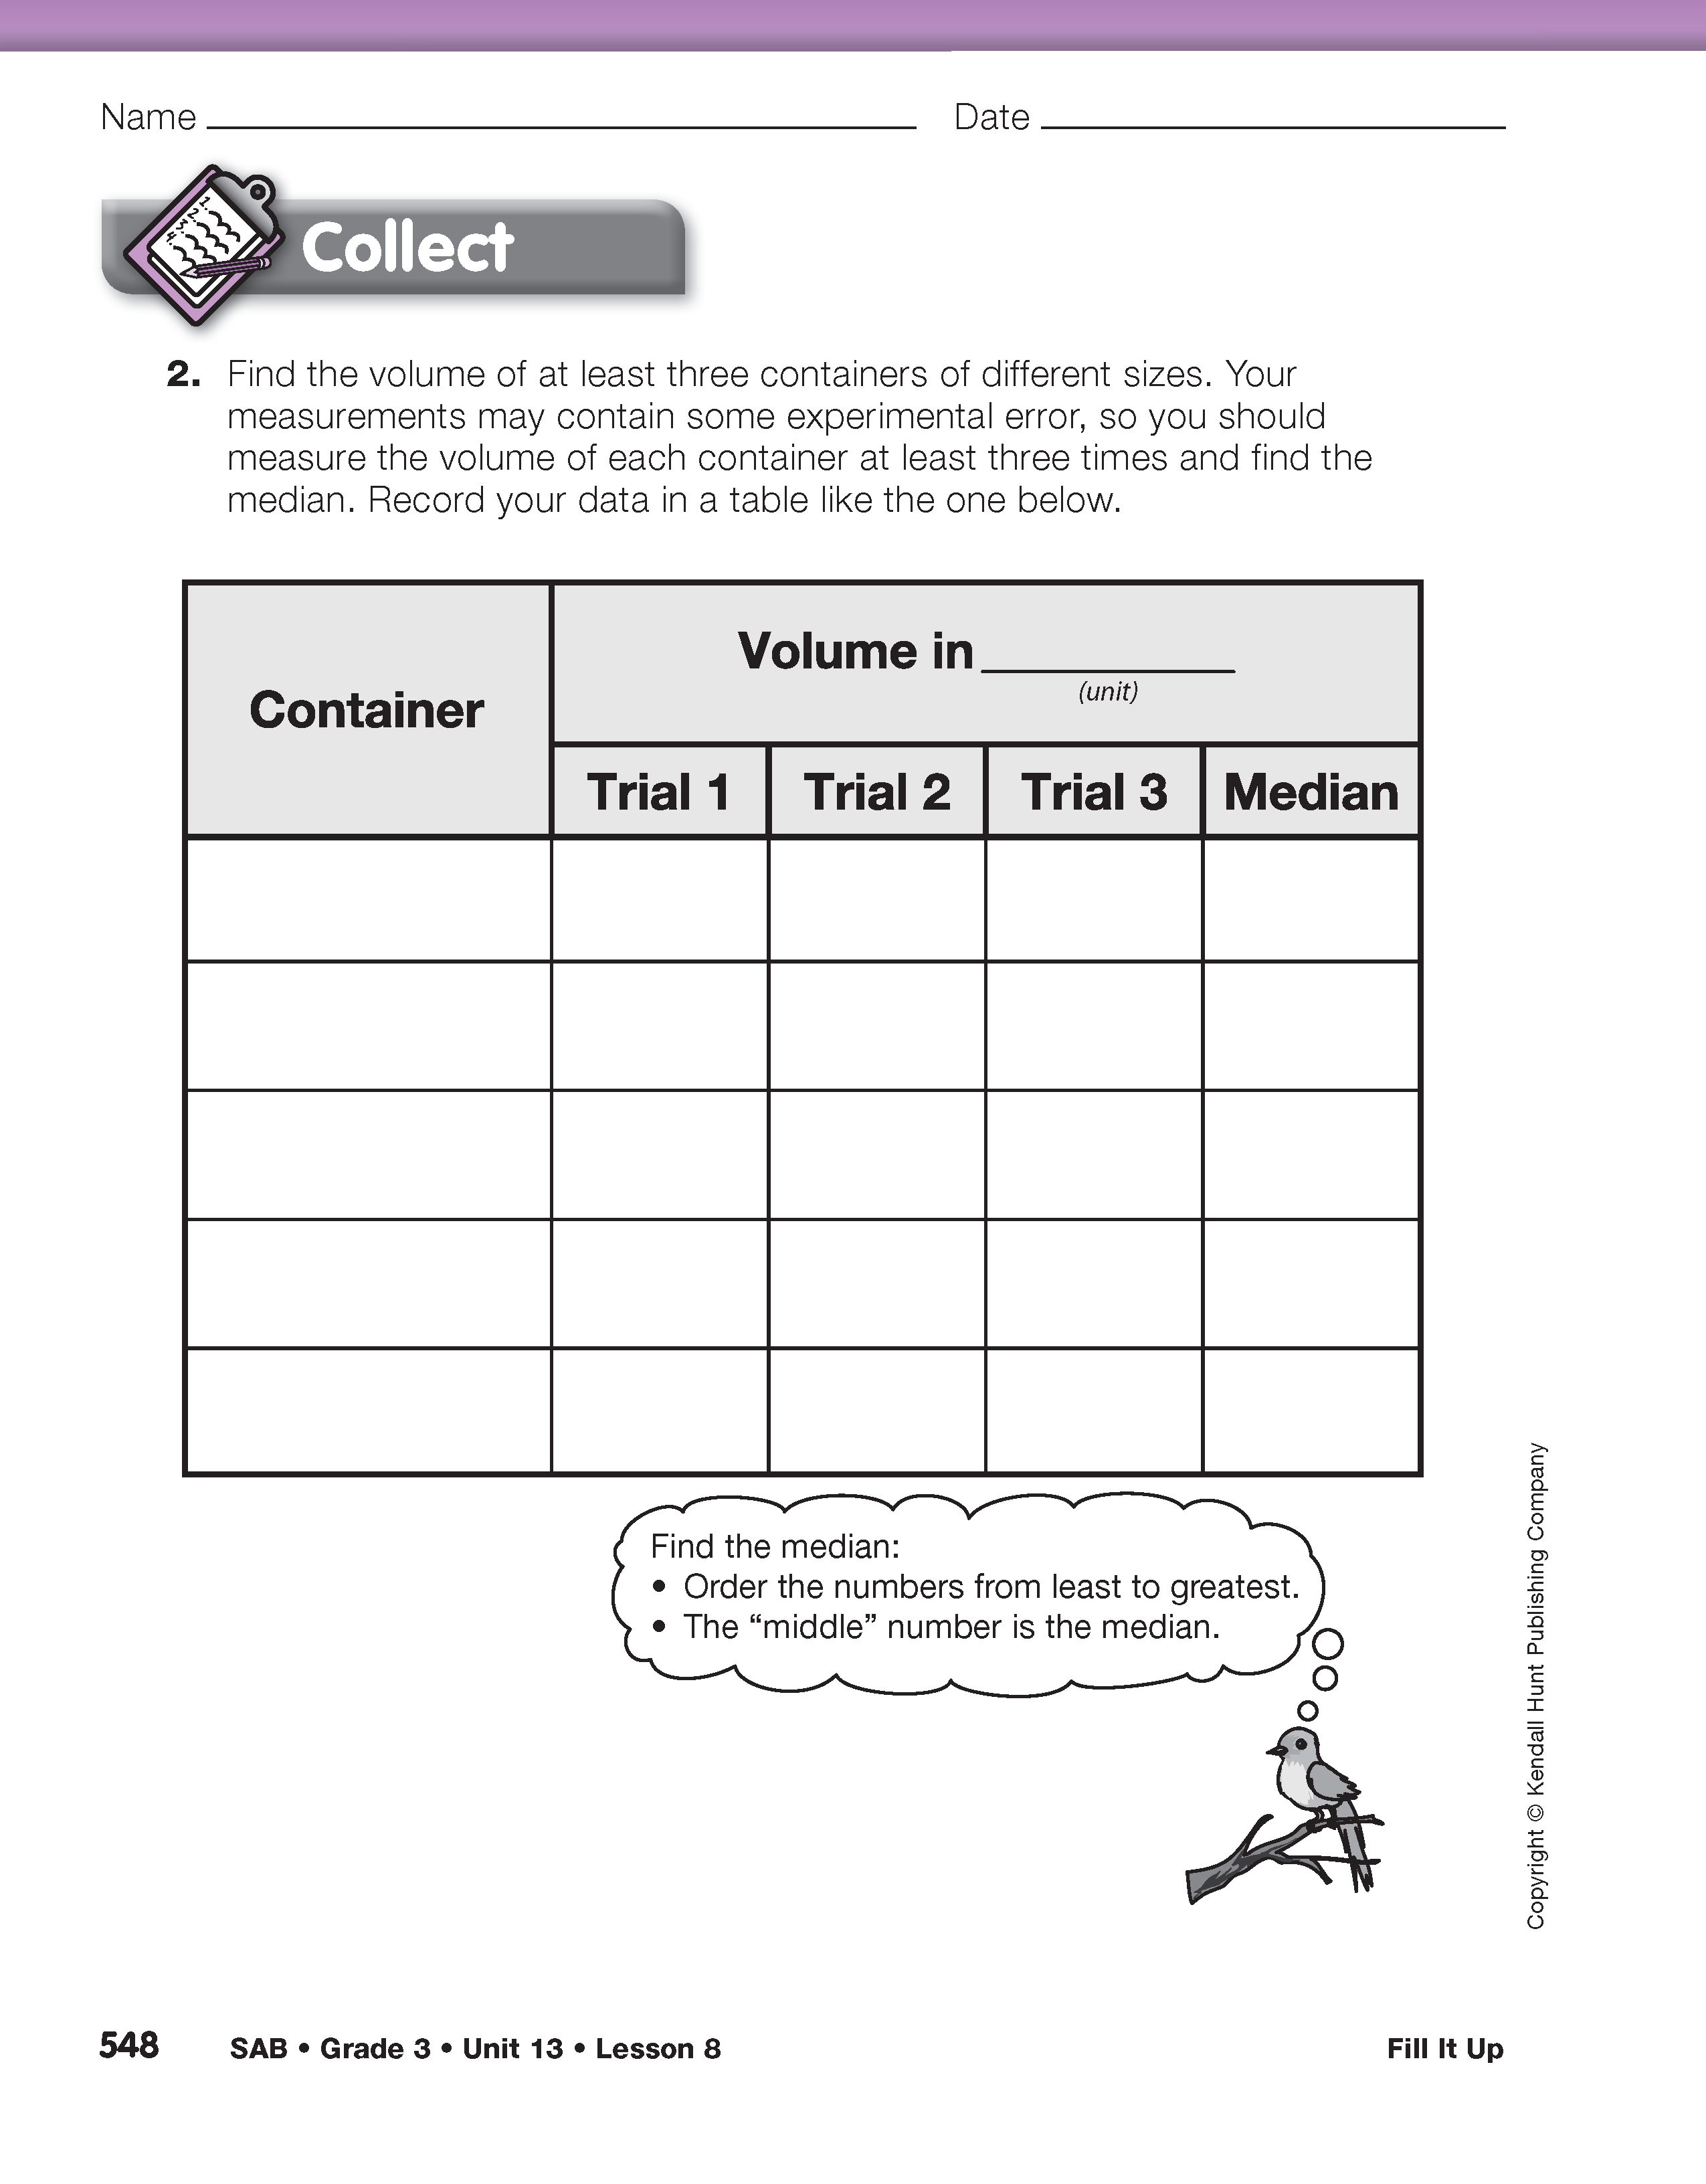
Part 3. Collecting and Recording the Data
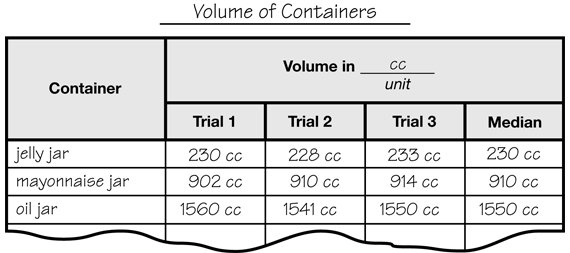
Collect Data. Direct students' attention to Question 2 in the Collect section of the Fill It Up Lab pages. They are now ready to collect data and record it in a data table. See Figure 3.
Ask:
Explain to students that they will measure the volume of each container three times and record the results under “Trial 1,” “Trial 2,” and “Trial 3” in the data table. By measuring each volume three times, students should obtain more accurate data. Then, they can graph the median of the three readings.
Students sometimes feel that they must record all data they take. However, one reason they conduct more than one trial is to detect errors in their data. If one of their three trials shows a value very different from the others, then it should be repeated. If repeating the trial confirms that the original value is probably incorrect, then it should be deleted and the new value recorded. Assure your students that this is not “cheating.” Judging the reasonableness of results is part of proper scientific procedure.
Assign Question 2. Have students work with their groups to find the volume of the different-size containers, record the data on the data table, and find the median volumes.

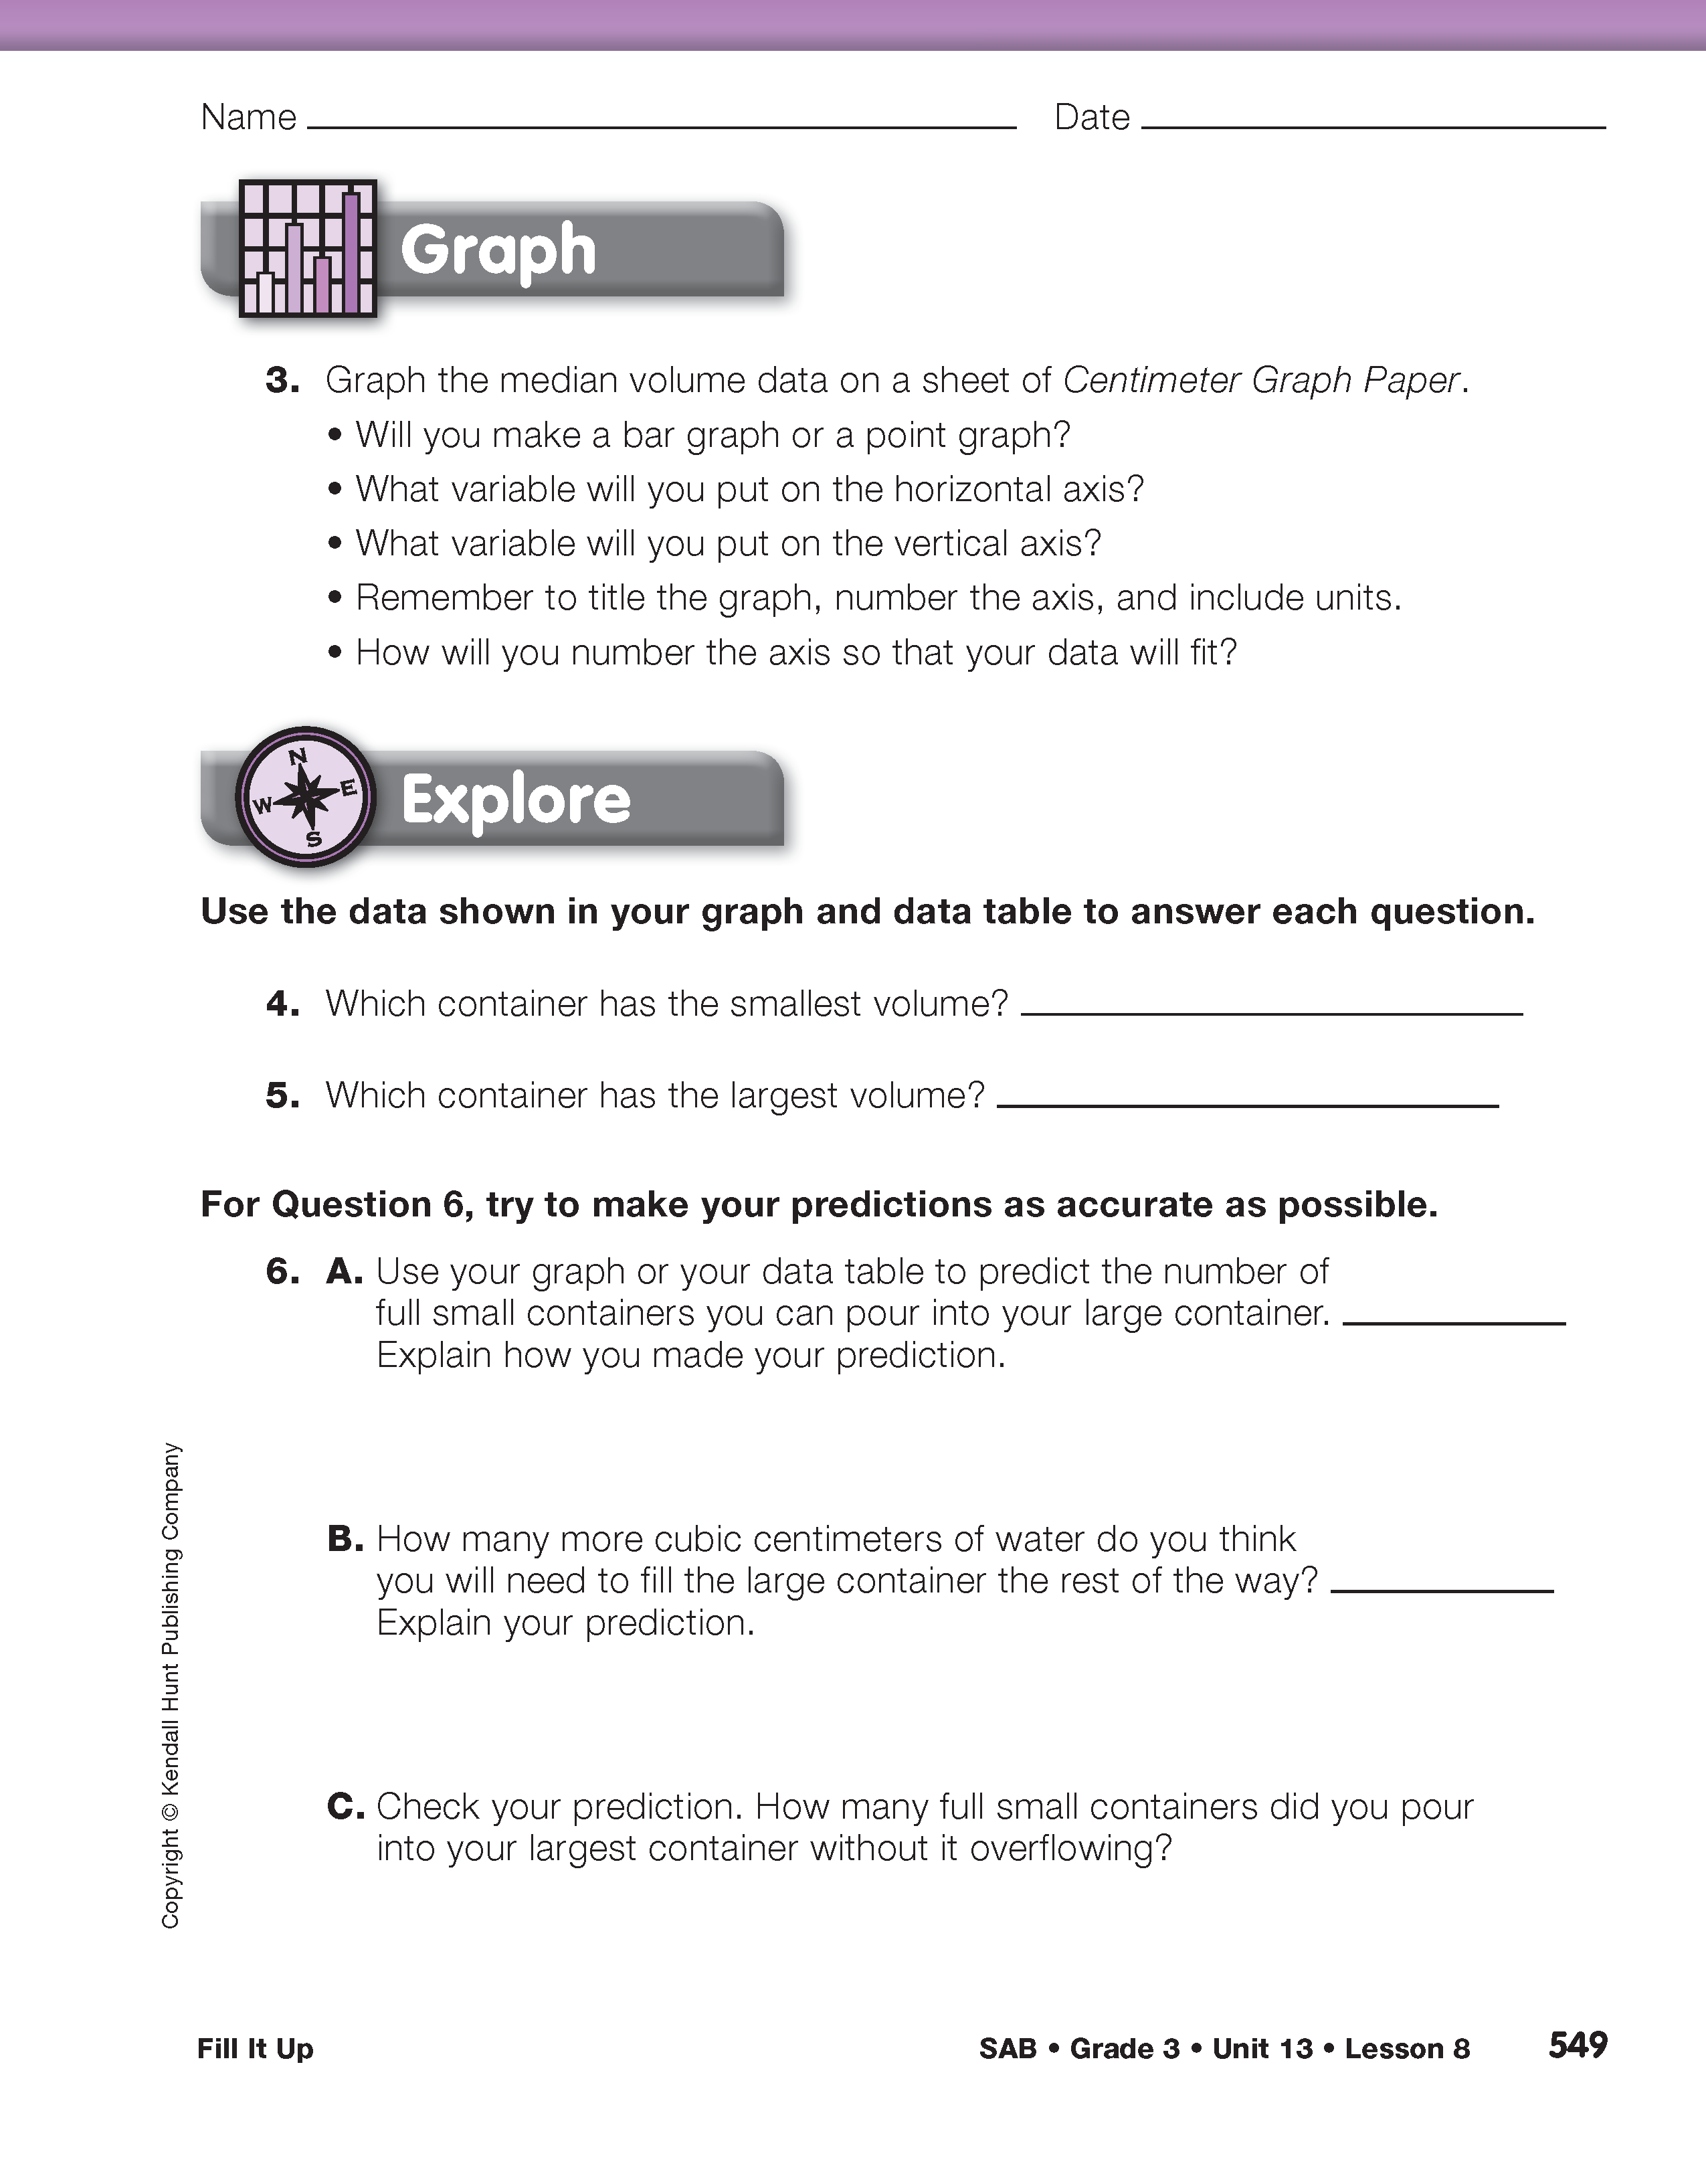
Make a Bar Graph. Once students have completed the data table, direct their attention to Question 3 in the Graph section of the Fill It Up Lab pages in the Student Activity Book.
Ask:
Discuss with students the reason a bar graph is appropriate but a point graph is not. We use a point graph when it makes sense to ask about values between data points and both variables are represented as quantities. For example, in Mass vs. Number in Unit 12, students measured the mass of 4 and 6 items and could ask about the mass of 5 or even 41/2 items. The point graph enabled us to interpolate those in-between masses. When graphing the volume of different containers, it doesn't make sense to ask about the volumes of containers “between the red and the blue container” or “between container A and container B.” Therefore, a line connecting the data points on a graph of the containers' volumes would not have meaning.
Say:
Figure 4 is a sample graph of data. Note that the axes are labeled with the variable names and units and that the lines are numbered, not the spaces. The sample graph shows the vertical axis numbered by 100s. Students may number the vertical axis differently, depending on the size of the numbers they obtain.
Distribute copies of the Centimeter Graph Paper Master. Ask students to graph the median values of their data.