Lesson 1

Ratios, Recipes, and Proportions

Est. Class Sessions: 2–3
X

Mathematical Standards

5.OA.B
Analyze patterns and relationships. (5.OA.B.3)

Standards for Mathematical Practice

MP1.
Make sense of problems and persevere in solving them.
MP2.
Reason quantitatively.
MP3.
Construct viable arguments and critique the reasoning of others.
MP4.
Model with mathematics.
MP5.
Use appropriate tools strategically.
MP6.
Attend to precision.
MP7.
Look for and make use of structure.
MP8.
Look for and express regularity in repeated reasoning.

Students use recipes as a context to learn about ratios using tables, graphs, and fractions. Students write ratios as fractions and use colon notation. A proportion is defined as A statement indicating that two ratios are equal. Students then use proportions and strategies for finding equivalent fractions to solve problems.

Content in this Lesson

  • Using words, tables, graphs, and fractions to express ratios.
  • Translating between different representations of ratios (graphical and symbolic).
  • Representing the relationship between variables as a ratio [E2].
  • Using ratios and proportions to solve problems [E4].
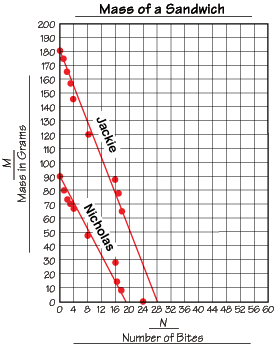
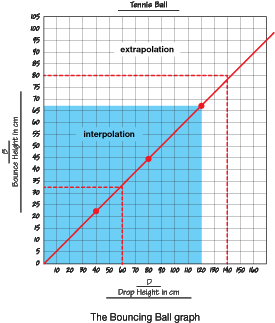
  • Collecting and organizing data into a table and line graph to represent the relationship between variables [E10].
  • Making point graphs and drawing best-fit lines to represent ratios and proportional relationships [E11].
  • Using patterns in tables and line graphs to make predictions and solve problems [E12].
X

Materials for Students

Daily Practice and Problems Lesson Homework Assessment

Student Books

Student Guide

Teacher Resources

Teacher Guide - digital

Supplies for Student Pairs

  • ruler
  • calculator
  • colored pencils, optional

Materials for the Teacher

Assessment in this Lesson

Assessment Expectation Assessed

Ratios, Recipes, and Proportions
Check-In: Questions 21–25
Student Guide
Page 523
with corresponding Feedback Box
Teacher Guide - digital

E2.
Represent the relationship between variables as a ratio.
E4.
Use ratios and proportions to solve problems.
E10.
Collect and organize data into a table and line graph to represent the relationship between variables.
E11.
Make point graphs and draw best-fit lines to represent ratios and proportional relationships.
E12.
Use patterns in tables and line graphs to make predictions and solve problems.