


Sampling and Proportions
Est. Class Sessions: 4Developing the Lesson
Part 2: Bats in a Cave Lab
Introduce the Lab. In this lab, a capture-recapture method is simulated to find an approximate number for the total number of bats in a cave. This process is modeled using beans in a bag to simulate bats in a cave. Read the Bats in a Cave Lab section of the Sampling and Proportion pages in the Student Guide to introduce the lab.
Ask students to imagine that each bean is a bat and the bag is a bat cave.
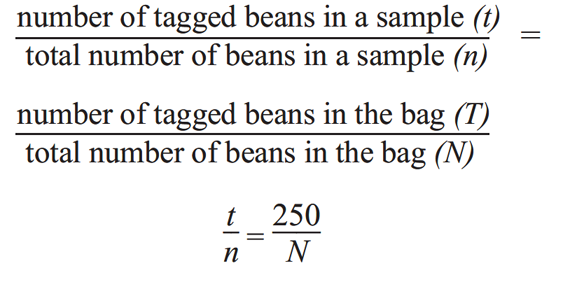
Students first tag 250 beans (bats) in their bags (caves). After thoroughly mixing the tagged beans with the untagged beans, each team of students follow the four steps of the TIMS Laboratory Method: Draw, Collect, Graph, and Explore. To collect the data, they take repeated samples of beans and count the number of tagged beans as well as the total number of beans in each sample. Finally, since the number of tagged beans in a sample (t), the total number of beans in a sample (n), and the total number of tagged beans in the bag (T) are known, equivalent ratios can be used to estimate the total number of beans in the bag (N). See Figure 2.
Tag the Bats. Divide students into teams of four and provide each group with the materials for the lab. The Tag the Bats sub-section in the Student Guide directs students to remove 250 of the beans from their bags, tag these 250 beans by marking them on both sides with a brightly colored marker, and mix the tagged beans back in the bags with the rest of the beans.

Model Sampling Procedure. After reading the Sample the Bat Population sub-section of the Student Guide, the class should develop a consistent sampling procedure using the scoops. All small samples should have approximately the same number of beans, all medium samples should have approximately the same number of beans, etc. For clarity, model the scooping procedure for the class.
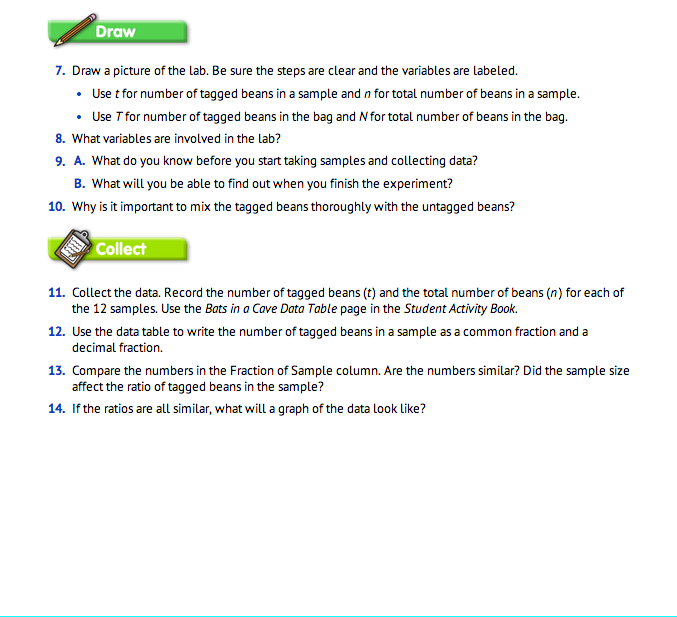
Draw a Picture. When students have a clear idea of what they are going to do, ask them to draw a picture that indicates the procedure and the key variables (Question 7). A sample picture is shown in Figure 3.
The picture should include:
- The cave with tagged and untagged beans.
- A sample of beans indicating that the number of tagged beans and the total number of beans in each sample will be counted.
- The variables labeled with symbols (t and n).
For Question 8, students list the variables involved in the lab. The object of the lab is to use two equivalent ratios to estimate the total number of beans in the bag (N), so this is an important variable. To find this estimate, students find values for the total number of beans in each sample (n), the number of tagged beans in each sample (t), and the number of tagged beans in the bag (T). Since T = 250 for the whole experiment, it is a fixed variable and this value is known before students begin sampling (Question 9A). When students finish with the experiment, they will be able to use the values in the data table to estimate a ratio for t/n and use it to find the total number of beans in the bag (N) (Question 9B).
It is important to mix the tagged and untagged beans together thoroughly so that random samples of beans of the same sample size will have approximately the same number of tagged beans (Question 10).
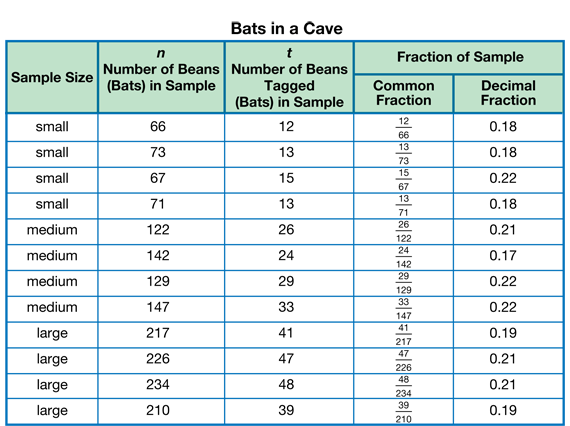
Collect Data. Direct students to the Bats in a Cave Data Table page in the Student Activity Book and assign Questions 11–14 in the Collect section of the Student Guide. Students will record their collected data on the tables (Question 11). Students need to collect 12 pieces of data, four for each sample size, recording the total number of beans (bats) in the sample (n) and the number of tagged beans in the sample (t). They will find a common fraction and a decimal fraction (Question 12) to show the fraction of the sample. Use a display of the Bats in a Cave Data Table page as needed to help students prepare. See Figure 4 for a sample data table. Circulate to see that students are measuring accurately and mixing the beans well before taking the next sample.
After students have completed the data table, discuss Questions 13–14. Students should recognize that the ratio of tagged beans to beans is the about the same no matter how large the sample size. Students should also recognize that all the data should be close to the same line (best-fit line) since the ratio is the same for each sample.
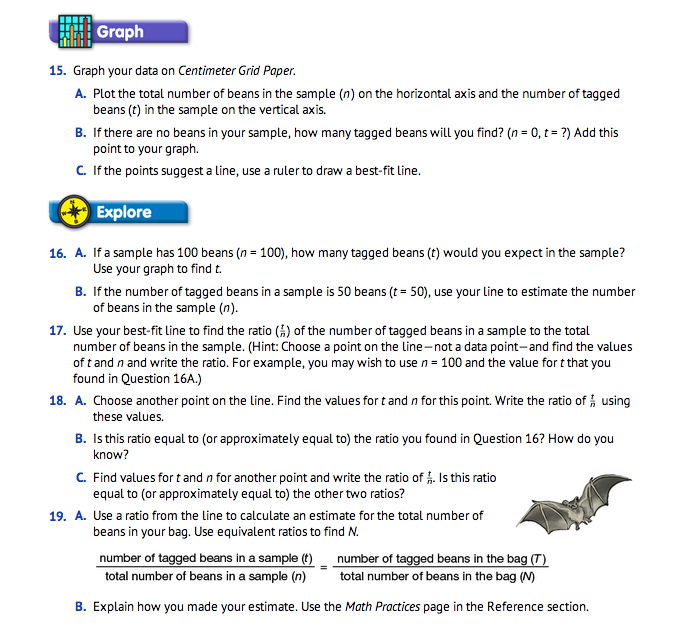
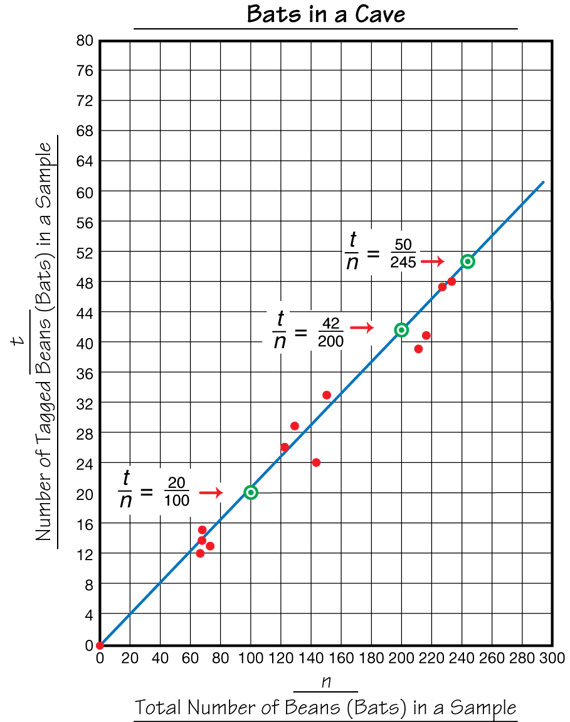
Graph the Data. Assign Question 15. Students plot the total number of beans in the sample (n) on the horizontal axis and the number of tagged beans in the sample (t) on the vertical axis (Question 15). Students should choose a scale for both axes that spreads out the data so that accurate values of n and t can be read from the line. If there are no beans in the sample, there will be no tagged beans in the sample either, so students should add the point (0, 0) to the graph. They then draw a best-fit line. A graph of the sample data is shown in Figure 5. Use a display of the Centimeter Grid Paper Master as needed.
Explore the Data. Assign Questions 16–20. For Question 16, students use the graph to find a value for t that corresponds to n = 100 and a value for n when t = 50. The points for these values are circled on the sample graph in Figure 5 and can be used in Question 17 to find the ratios of t/n:
t/n = 20 tagged beans/100 beans in sample
t/n = 50 tagged beans/245 beans in sample
Choose another point on the line and use it to write a ratio for t/n to see that the ratios are equal or approximately equivalent (Question 18). For example, the value for the number of tagged bats (t) for a sample of 200 bats is about 42, so the ratio of t/n can be written as shown:
t/n = 42 tagged beans/200 beans in sample
Using a calculator, students can find the decimal equivalent for each ratio rounded to the nearest hundredth: 20/100 = 0.20, 50/245 = .20, and 42/100 = 0.21. So, each of the three ratios taken from the line are approximately equal to one another. (See Figure 5.) These fractions are each approximately equivalent to 1 tagged bean/5 beans or one tagged bean for every 5 beans in a sample.
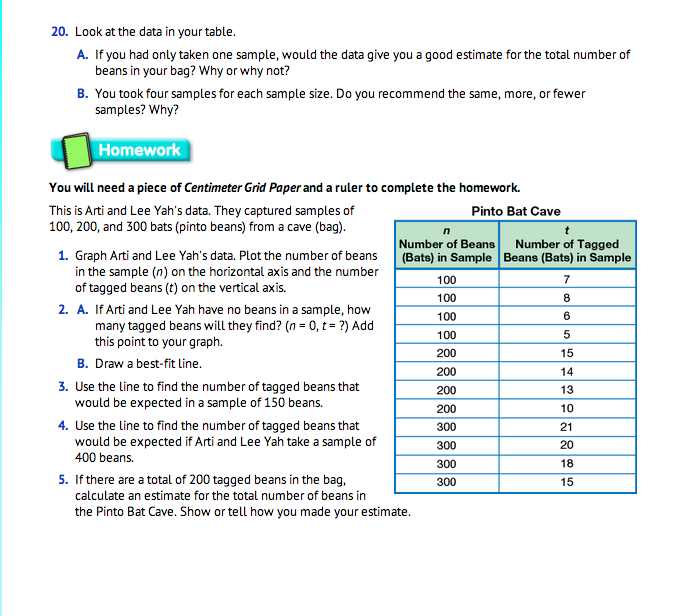
For Question 19, students use the data they have collected to estimate the total number of beans in their bag and to explain their solution strategies. There are many possible solution paths and answers will vary slightly. However, since all groups started with about 1 pound of beans, their estimates for the total number of beans (N) should be relatively close to one another.
To solve the problem, assume the following two ratios are equivalent to one another:
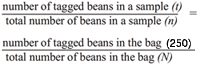
Students choose a ratio from a point on the line and set up a proportion:
50 tagged beans/245 beans = 250 tagged beans/N
To find N, student multiply the numerator and denominator by the same number. Since 50 × 5 is 250, students can multiply the numerator and denominator by 5 to find a fraction that is equivalent to 50/245.
50 tagged beans/245 beans = 50 × 5/245 × 5 = 250 tagged beans/N
So, there are about 245 × 5 or 1225 beans in the bag.
Another solution path uses the ratio 1 tagged bean out of every 5 beans in the sample:
1 tagged bean/5 beans = 250 tagged beans/N
1 tagged bean/5 beans = 1 × 250/5 × 250 = 250 tagged beans/N
Using this method, N = 5 × 250 or 1250 beans in the bag. Note that our two estimates are very close. Encourage students to solve the problem in more than one way to check their results and to give clear and complete explanations of their methods.