


Explore Circumference and Diameter
Est. Class Sessions: 4Developing the Lesson
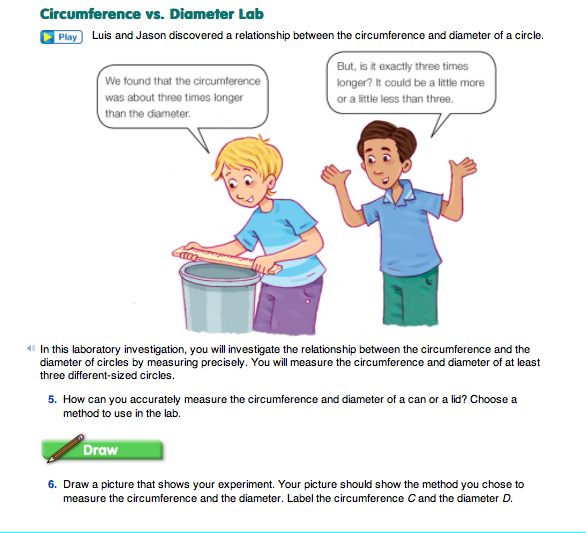
Part 2: Circumference vs. Diameter Lab
Discuss Measurement Techniques. Read together the vignette of Luis and Jason talking about the circumference being about three times the length of the diameter. They wonder if it is exactly 3 times the length or a little more or a little less.
Ask:
During this investigation, students will carefully measure the diameter (D) and the circumference (C) of at least three different-sized circles. They will record their information in a table, graph the data, and then look for the relationship between the two variables: circumference and diameter. The examples in the Lesson use cans or jar lids, since they are easier to measure than a circle drawn on paper.
Have students discuss with a partner ways to more accurately measure the circumference and diameter of a circle (Question 5). Circulate and listen for student ideas. Some possible ways to measure the circumference and diameter follow:
- Use a ruler to measure the diameter.
- Use a string to measure the circumference and diameter. Then, measure the string with a ruler to the nearest tenth of a centimeter. (It is important to use string that does not stretch so the measurement will be accurate.)
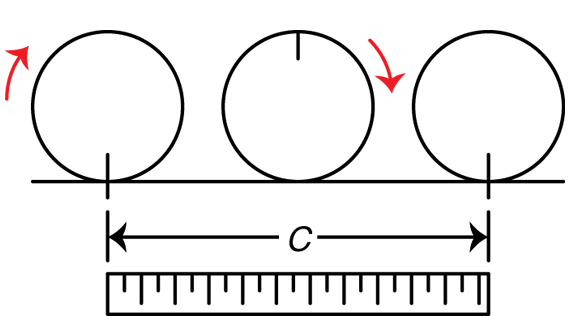
- Roll a can along a piece of paper until it completes one revolution. Mark the beginning of the roll and the end of the roll on the paper. Then, measure the distance between the marks to find the circumference. Students should mark their starting point on the can with a piece of tape or a pen mark, so they know when they have completed one revolution. If this method is used, emphasize the importance of rolling the can in a straight path. Cans have a tendency to slide, which makes the data less accurate. See Figure 2.
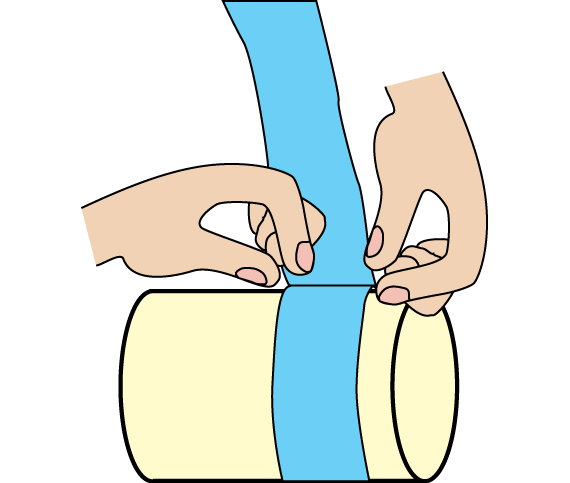
- Wrap adding machine tape around the can or lid and mark the start and end points to measure the circumference. Students will find it easier to mark the start and the end points if they lay the can on its side. See Figure 3.
When measuring the diameter of a circle, students must make sure that their ruler crosses through the center of the circle. On some lids, there may be a small point in the plastic that designates the center. If students are using circles that do not have a designated center, instruct them to find the longest length that connects opposite sides of the circle. They may need to take a couple of measurements to be sure they found the longest length. This length is the diameter.
Have students discuss techniques for measuring their particular cans or lids. For example, a coffee can may have grooves so they should not take a measurement for the circumference in a groove because the circumference of that circle does not correspond to the diameter measured at the top of the can. In all cases, students need to measure the circumference of the circle that corresponds to the diameter they measured.
Tell student pairs that they will measure the circumference and diameter of at least three different-sized cans or lids in this investigation. They will measure a small, a medium, and a large circle. Discuss with students that although they may be measuring three-dimensional objects, they are investigating the circle, which is two-dimensional. Students should use the same method to measure all three circles. Using the same measurement method helps to minimize experimental error.
Draw a Picture. Once students are familiar with the measurement procedure they will use, direct them to draw a picture of the investigation (Question 6). Students should identify the variables diameter and circumference in their drawings. See Figure 4 for a sample picture.
Assign Home Practice Part 6 as homework.
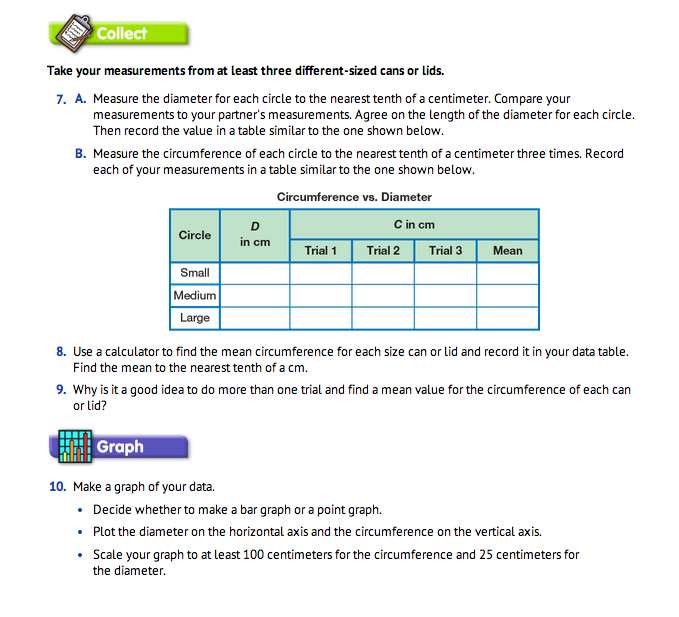
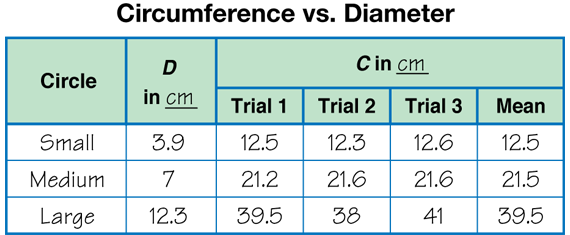
Collect Diameter Data. Student pairs should carefully measure the diameter of each circle to the nearest tenth of a centimeter (Question 7A). To ensure that pairs have found the best measurements for the diameter, each partner should measure the diameter. Partners can then compare their measurements to see if they are accurate. If the measurements differ, each partner should measure the diameter and compare the measurements again. The process should continue until pairs agree on the length for the diameter. Have students record this value on copies of the Three-Trial Data Table Master. Students will need to draw an additional line in the left-hand column on their Three-Trial Data Table to create an extra column. Use a display to demonstrate. Then there will be a column for size of circle and one for D. This is shown in Figure 5.
Measure Circumference. Then student pairs should measure the circumference of each circle three times to the nearest tenth of a centimeter and record each of their measurements in the data table (Question 7B).
Find Mean. For Question 8, students find the mean value of their circumference measurements and record it in their data tables. Before finding the mean value, students should examine the three values of the circumference. If the three values are very different (not within 10%), they should measure again more carefully.
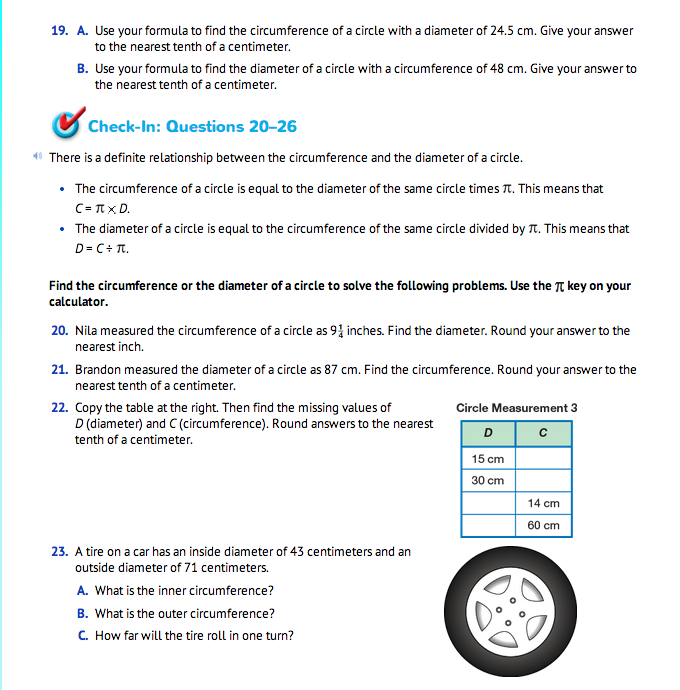
For Question 9, students discuss why they should find the mean value of the circumference measurements. Since the process of measuring the circumference involves more steps than measuring the diameter, it is likely to have more experimental error. Finding the mean value helps to eliminate some of the experimental error. A sample data table is shown in Figure 5.
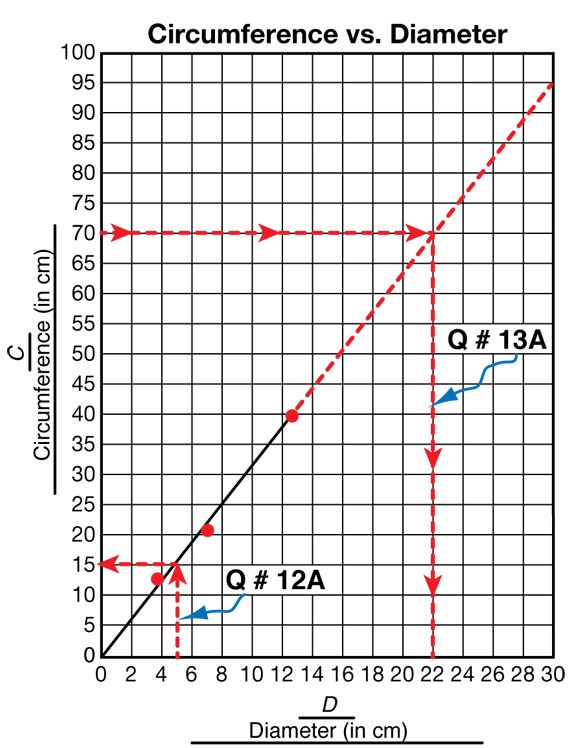
Graph Data. For Question 10, students plot a graph for their data on copies of the Centimeter Grid Paper Master. Students should determine whether a bar or a point graph is appropriate for the data. In this experiment both variables—circumference and diameter—are numerical. Since both variables are numerical and we are going to use patterns on the graph to make predictions, a point graph is the best choice.
Students will need to scale their graphs to at least 100 centimeters on the vertical axis and 25 centimeters on the horizontal axis to answer Question 10. Students should plot the diameter on the horizontal axis and the circumference on the vertical axis. A sample graph is shown in Figure 6. Use a display to demonstrate as needed.
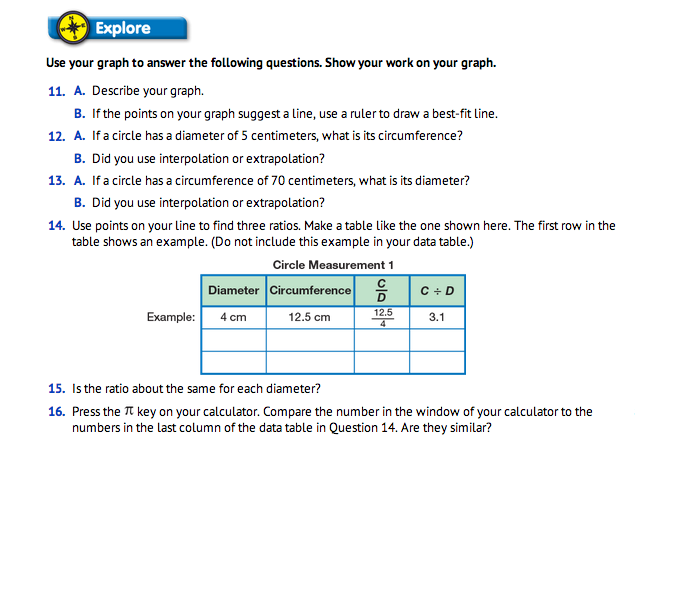
Use Graph to Explore Circumference vs. Diameter. Assign Questions 11–16. The points on students' graphs should suggest a line (Question 11). Students should draw a best-fit line for their data points as shown in Figure 6.
For Questions 12–13, students interpolate or extrapolate information using the best-fit line. Students should show their work on their graphs. A diameter of 5 centimeters has a circumference of approximately 15 centimeters while a circumference of 70 centimeters has a diameter of approximately 22 centimeters as shown on the sample graph. Sample work has been drawn on the graph in Figure 6.
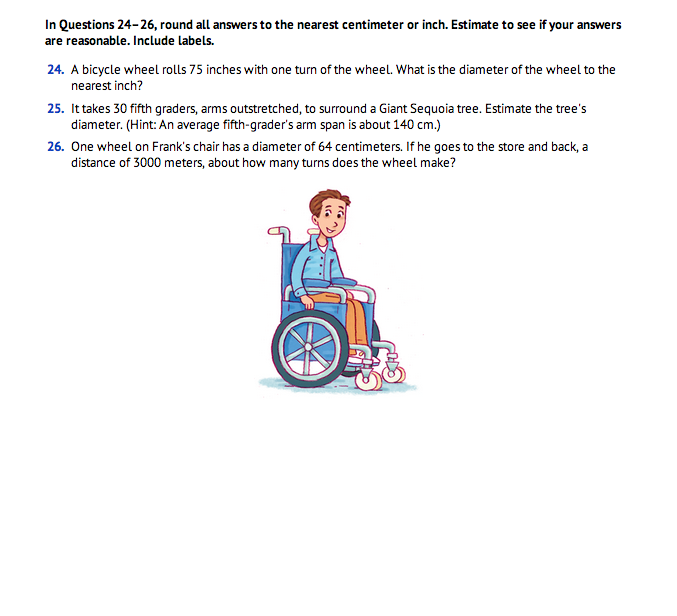
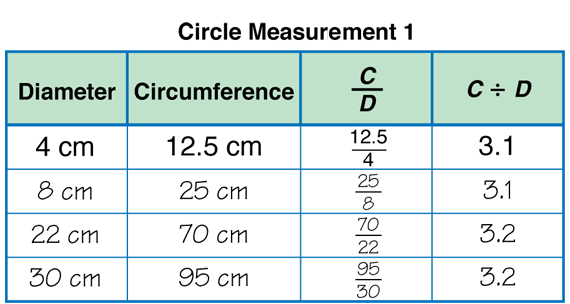
Use Question 14 to begin the exploration into the exact relationship between circumference and diameter. Students are asked to use points on their line to find three approximately equal ratios. Using points on their line, they record the values of the circumference and diameter of three circles, write the circumference over the diameter as a fraction, then divide the circumference by the diameters (see Figure 7). Encourage students to try to find points on the grid lines, since this will result in more accurate values. Students should notice that their answers for the three ratios in Question 14 result in approximately the same number. For the sample graph shown in Figure 6, the ratios are approximately 3.1 to 3.2.
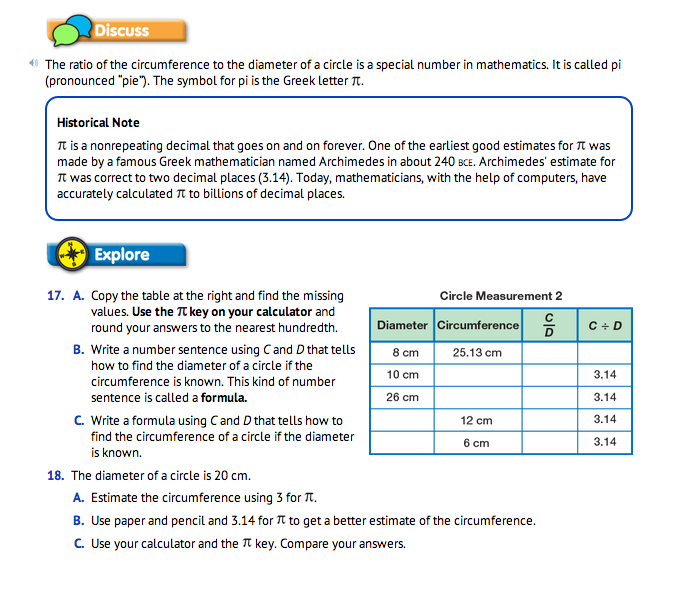
Use Question 15 to have students explore whether the ratios of the circumference to the diameter are approximately equal. Although we can never measure exactly, if we could, the ratio would be exactly equal to a special number called π (pi). π is a little bit more than 3. A good estimate is 3.14.
For Question 16, students press the π key on their calculators and compare the number in the window of their calculator to the numbers in the C ÷ D column of their data tables. They should find that their data should be very close to 3.14.
Lab Assessment. Make a packet of each student's lab work to include their drawing, data table, graph and questions (Questions 6–16) for the Circumference vs. Diameter Lab. Use this work to assess student progress in representing variables and procedures in a drawing, measuring circumference and diameter to the nearest tenth, collecting and organizing data in a table and a graph, drawing a best-fit line, and using these representations of ratios and proportions to solve problems.
When students understand that the circumference of a circle is about 3 times the diameter, assign the Going around in Circles page in the Student Activity Book as homework. Make sure they are able to enter π on their calculators. On some calculators, the SHIFT or 2nd key must be pressed before pressing π.


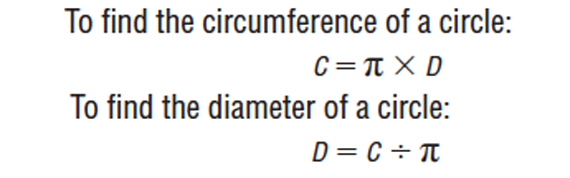
Use Pi to Solve Problems. For Question 17A, students find missing values in a table relating circumference and diameter. Lead students to realize that by multiplying the diameter by π, we can find the circumference (C = π × D). To find the diameter, given the circumference, we divide circumference by π (D = C ÷ π).
Use Question 18 to lead students to think more about accuracy. Since the π key on the calculator gives the best estimate for π, the most accurate answer is obtained by using the π key. Instruct students to use the π key when solving problems.
Following Question 19, the relationship between circumference and diameter is spelled out formally in words and symbolically in formulas to assist students when working through a variety of problems. Give students problems where they know either the circumference or the diameter and have to find the other to practice working with the formulas. For example, if the diameter is 7 cm, find the circumference. If the circumference is 20 cm, find the diameter. See Figure 8.
Assign Check-In: Questions 20–26 for students to complete independently. In Questions 20–23, students use ratios for the relationship for circumference and diameter to solve problems. Students may use the π key on their calculator as an aid. For Questions 23–24, remind students that the tire or wheel travels a distance equal to the circumference of the circle in one turn. Students use ratios to solve word problems in Questions 24–26.