


Measure with Unusual Units
Est. Class Sessions: 3Developing the Lesson
Part 1: Measuring with Different Units of Measure

Review Measurement Advice. Ask students how they can measure the length of an object using different measuring tools.
For example, ask:
Display a pencil and paper clips. Prompt the discussion by leaving gaps between the paper clips, using large and small paper clips, and arranging the paper clips in a zig-zag fashion.
Ask:
Display the Measuring Advice chart from Lesson 2. Review the suggestions already posted. Add to the list as different points come up in the discussion.
Guide the discussion to focus on these central ideas:
- Measurements need to be reported as both the number of units and the kind of unit (e.g., 7 small paper clips).
- Measurements should be made with units that are all the same; switching from large paper clips to small paper clips, for instance, is not a good idea.
- Units should be placed end to end—no overlaps or gaps.
- Units should be placed, as nearly as possible, in a straight line.
- Sometimes a measurement includes a part of a unit. Let students decide how they will handle such measurements. Some may prefer "between 7 and 8 paper clips," while others may say "closer to 8 paper clips" or "almost 8 paper clips."
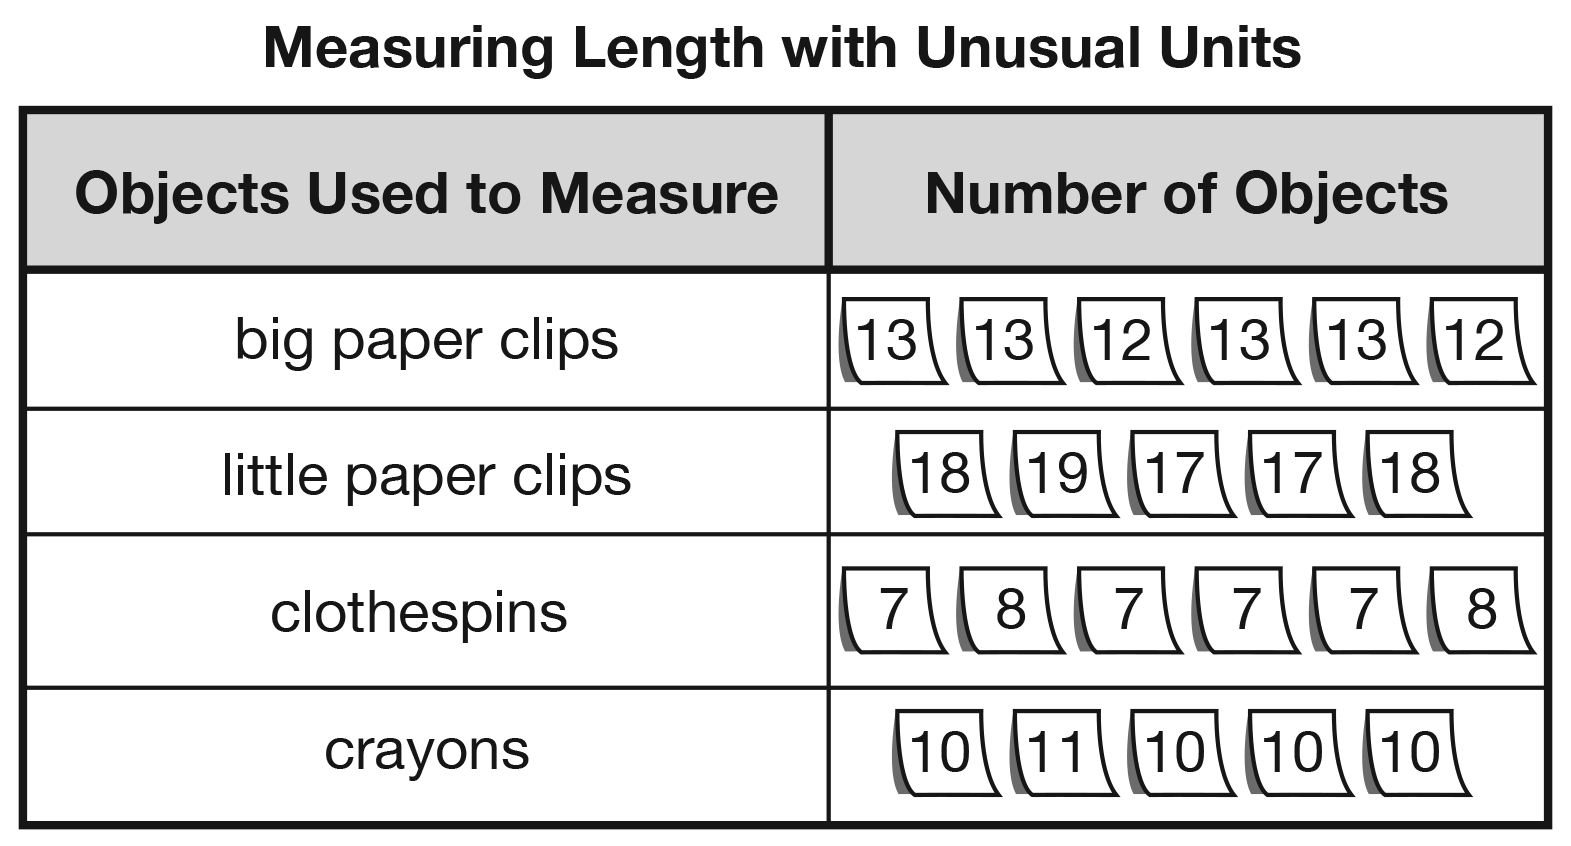
Measure a Desk with Unusual Units. Display the Measuring with Unusual Units chart you prepared prior to the lesson. See Materials Preparation. Show students you have listed the four nonstandard units of measure on the data table. Distribute two different sets of nonstandard units you prepared to each student group. Make sure that each group receives two containers of measuring objects that are of noticeably different size, such as a box of connecting cubes and a box of clothespins. The difference in measurement should be easy to identify. Each group will measure the length of a desk using these two different objects, once using the smaller unit of measure and once using the larger unit of measure. Give each student group two self-adhesive notes on which they will record their two measurements.

Record Data on Chart. After each group measures the length of a desk twice, have them place their selfadhesive notes in the Number of Objects column next to the appropriate object on the Measuring Length with Unusual Units chart. See Figure 3 for an example chart.
The groups that measured the desk with the same unit of measure should have the same or very close results. If this does not happen, ask how the differences might be handled. Students might suggest measuring again. Others may point out that different groups dealt differently with partial units. If there are significant differences in measurements using the same unit, it may be necessary to refer back to the Measuring Advice chart to correct erroneous techniques and understandings. Before beginning the graph, decide on one measurement for each object used.
Ask:
Remove all the self-adhesive notes and record the one agreed-upon measurement for each of the four objects used to measure in the Number of Objects column.
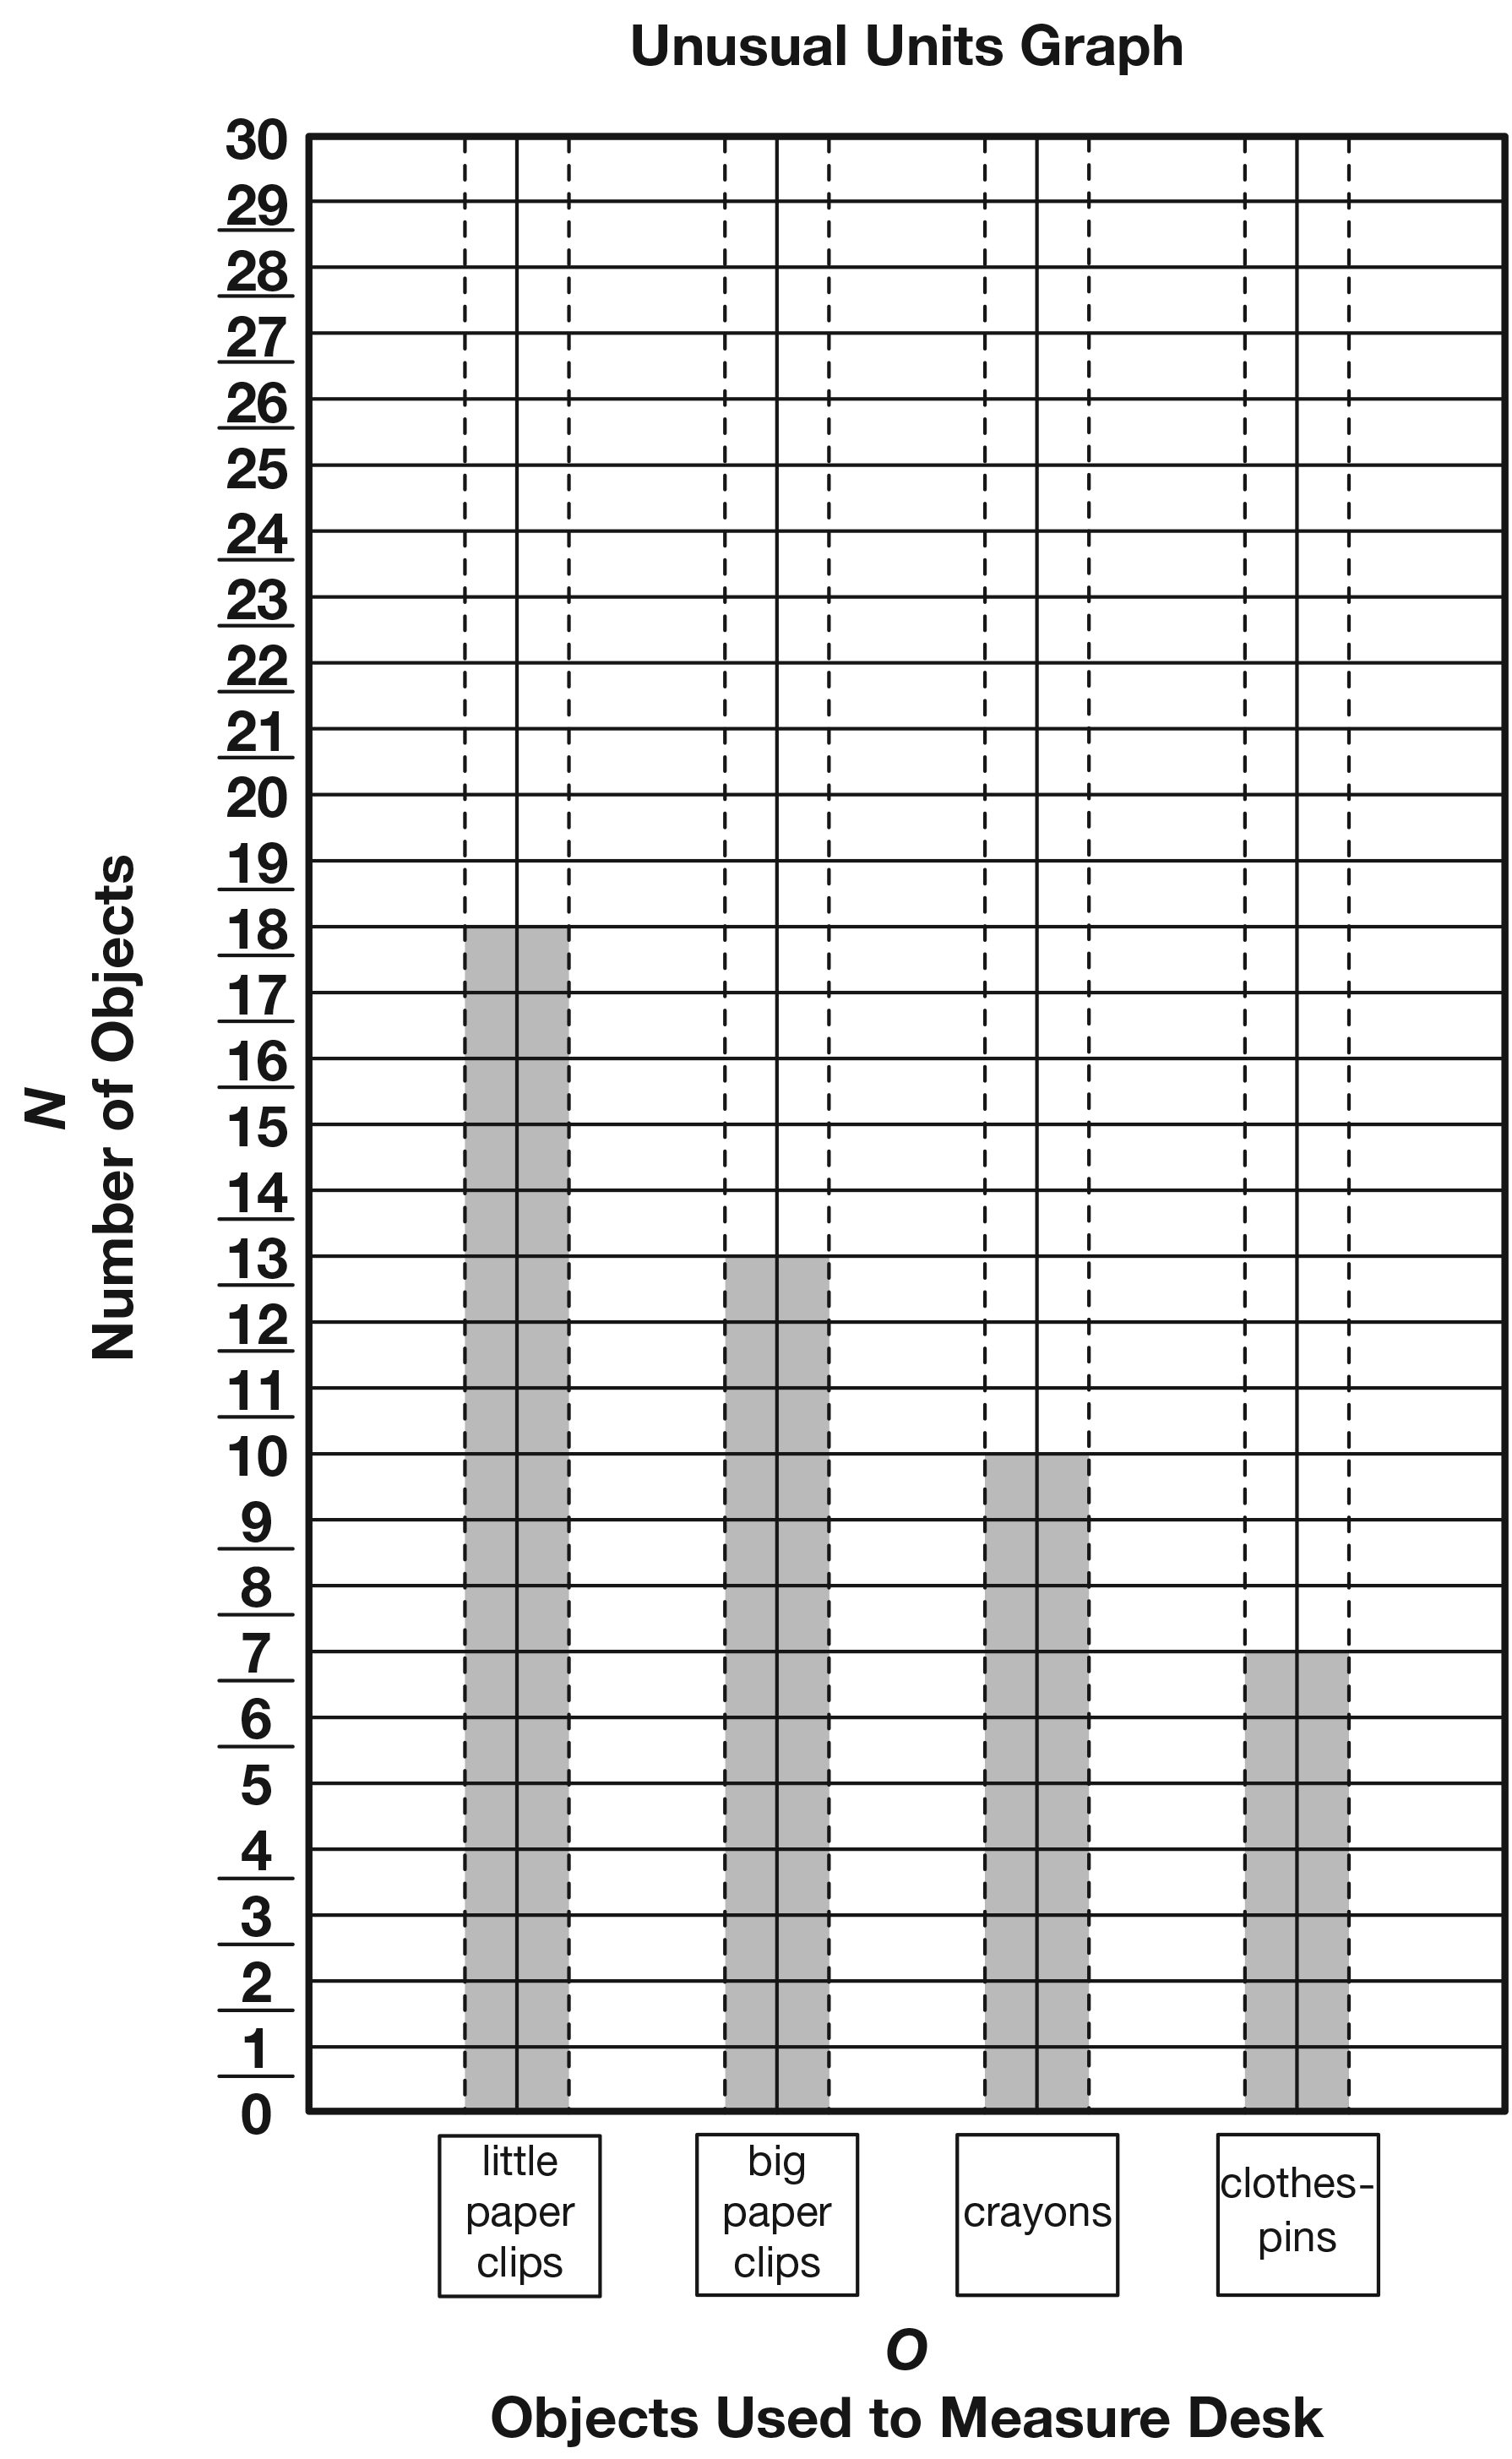
Display the Unusual Units Graph Master. List the objects used as measuring units from shortest to longest along the horizontal axis of the graph.
Ask:
Have student volunteers assist you by filling in the bars on the graph. See Figure 4 for a sample graph.