Invite students to compare their completed Rolling
Along With Links data tables to the empty graph in
the Student Activity Book.
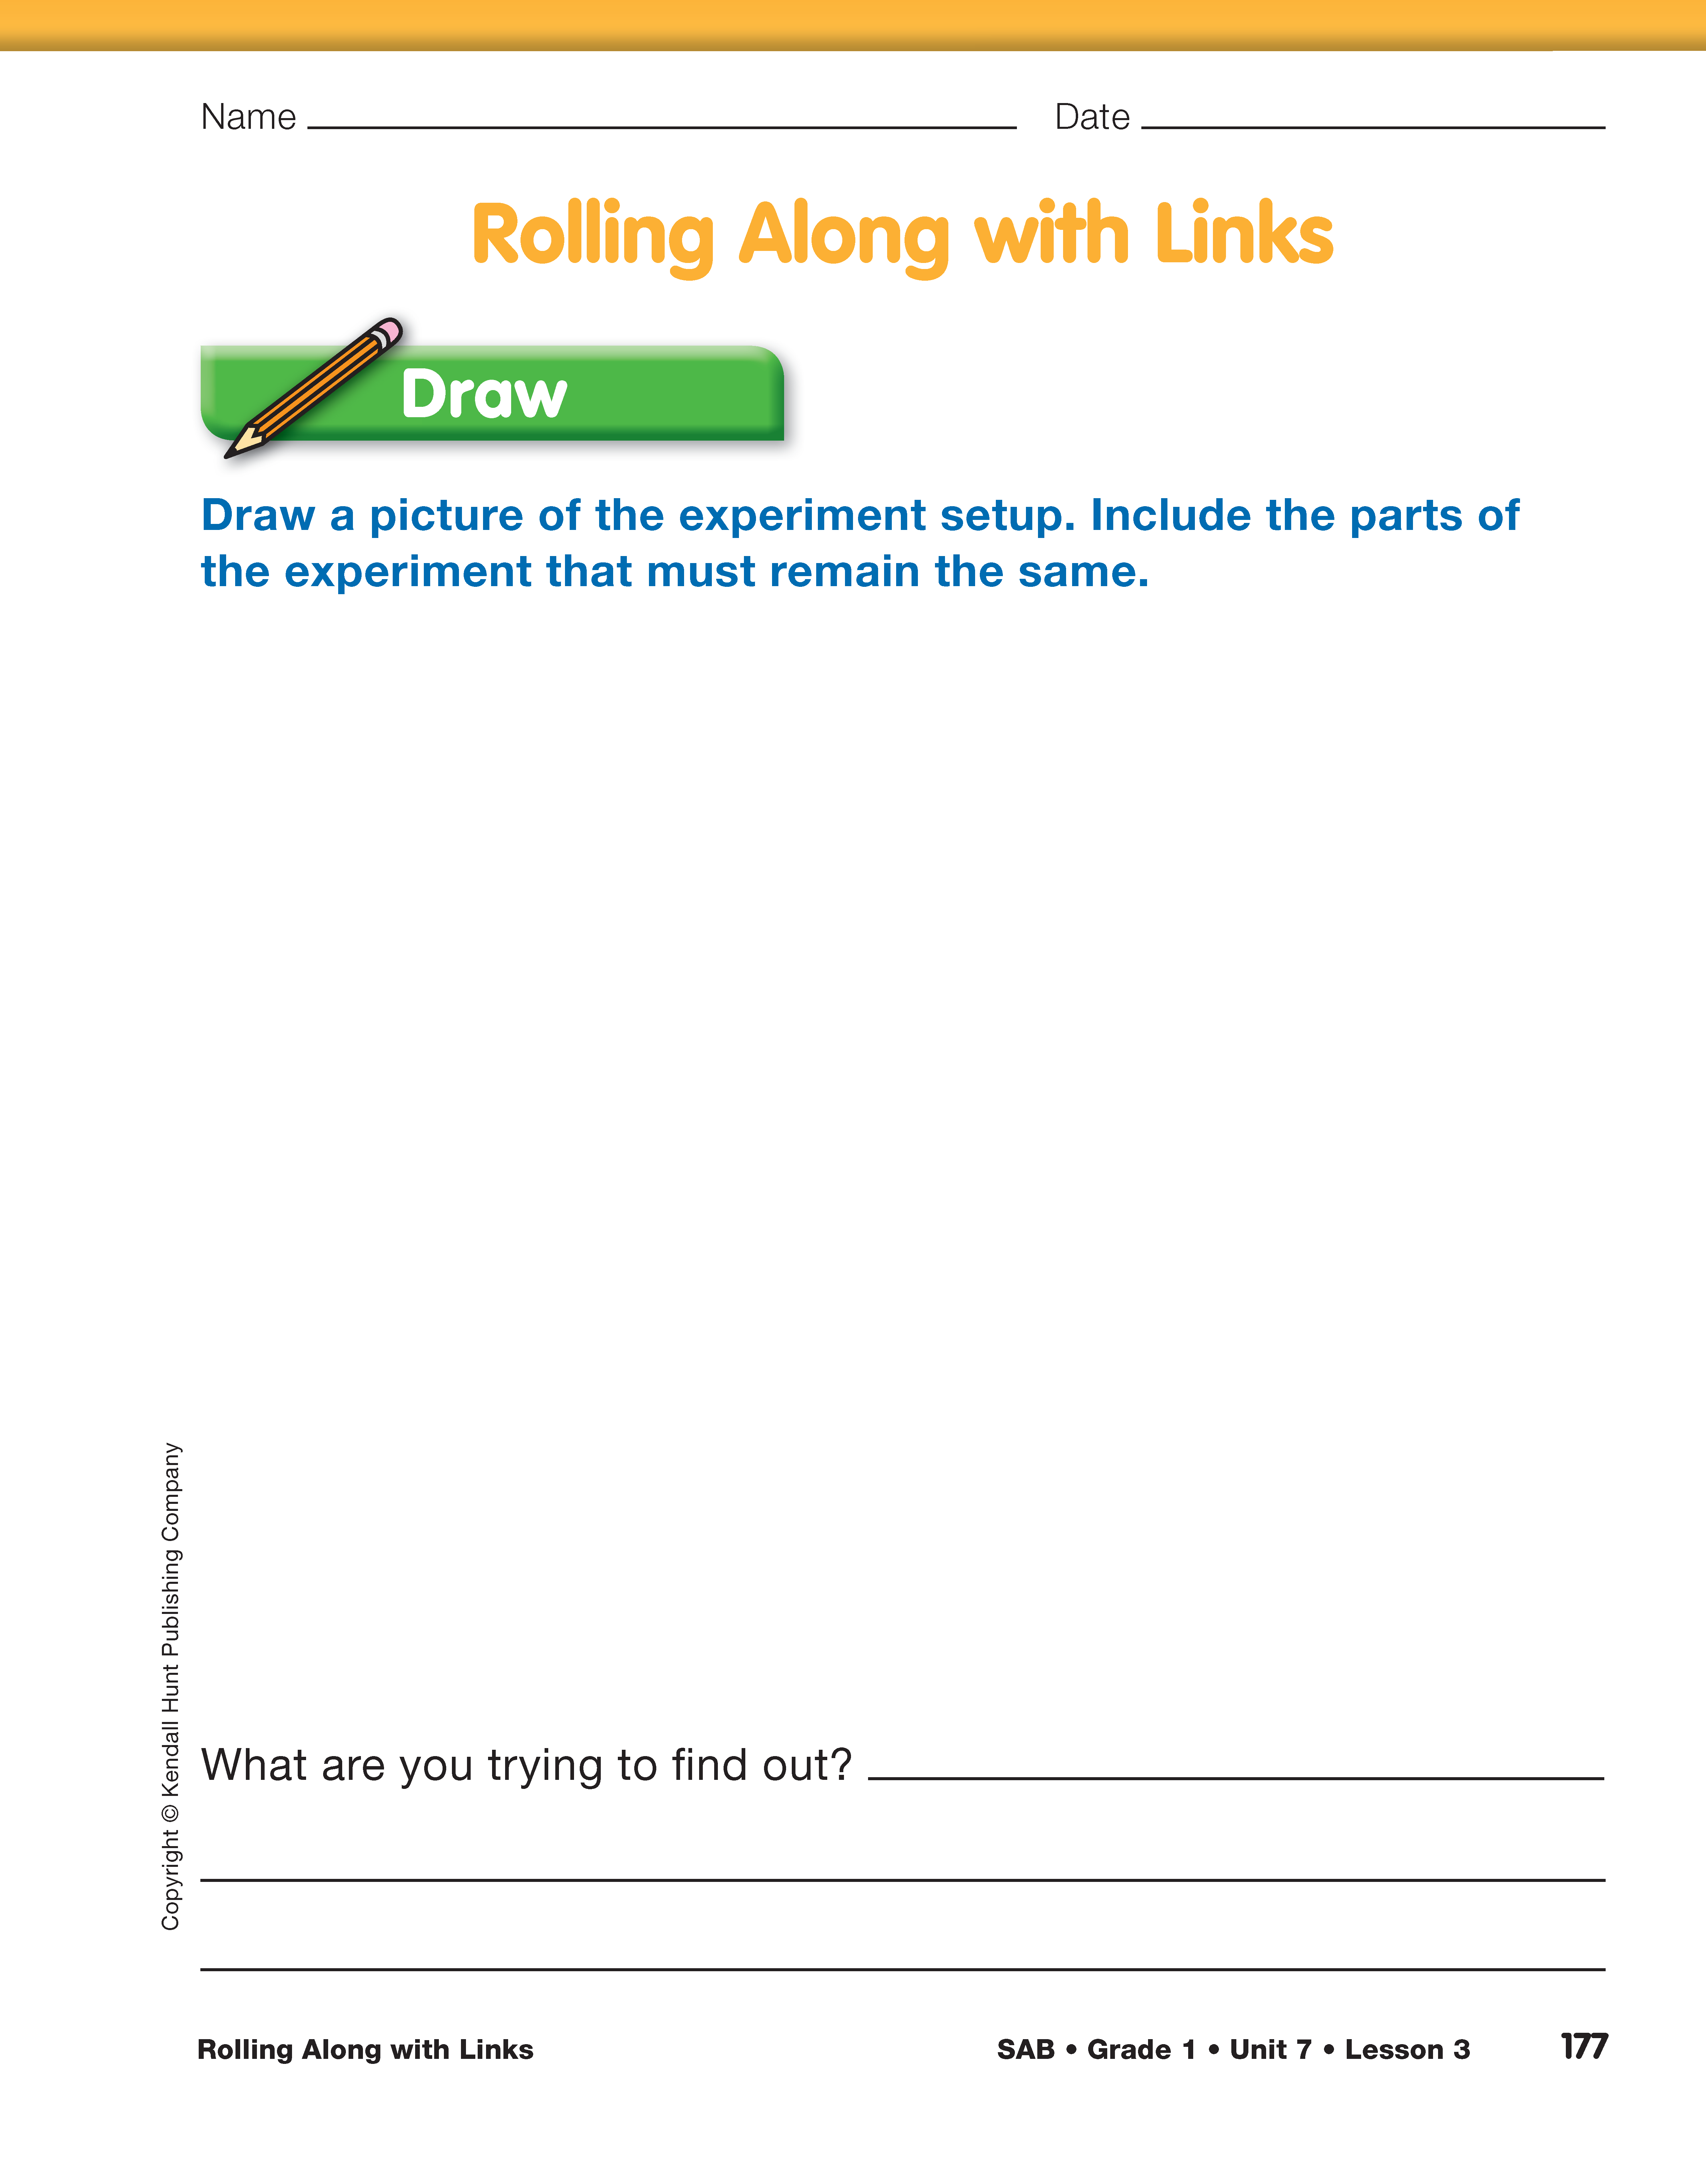
- How is the data table like the graph? What do you
see that is on both pages? (They have the same
title "Rolling Along With Links." They both
have the words, "T Type of Car" and "D Distance
Rolled.")
- What does T stand for? (Type of Car)
- What does D stand for? (Distance or how far the
car rolls)
- What unit needs to be included? (links)
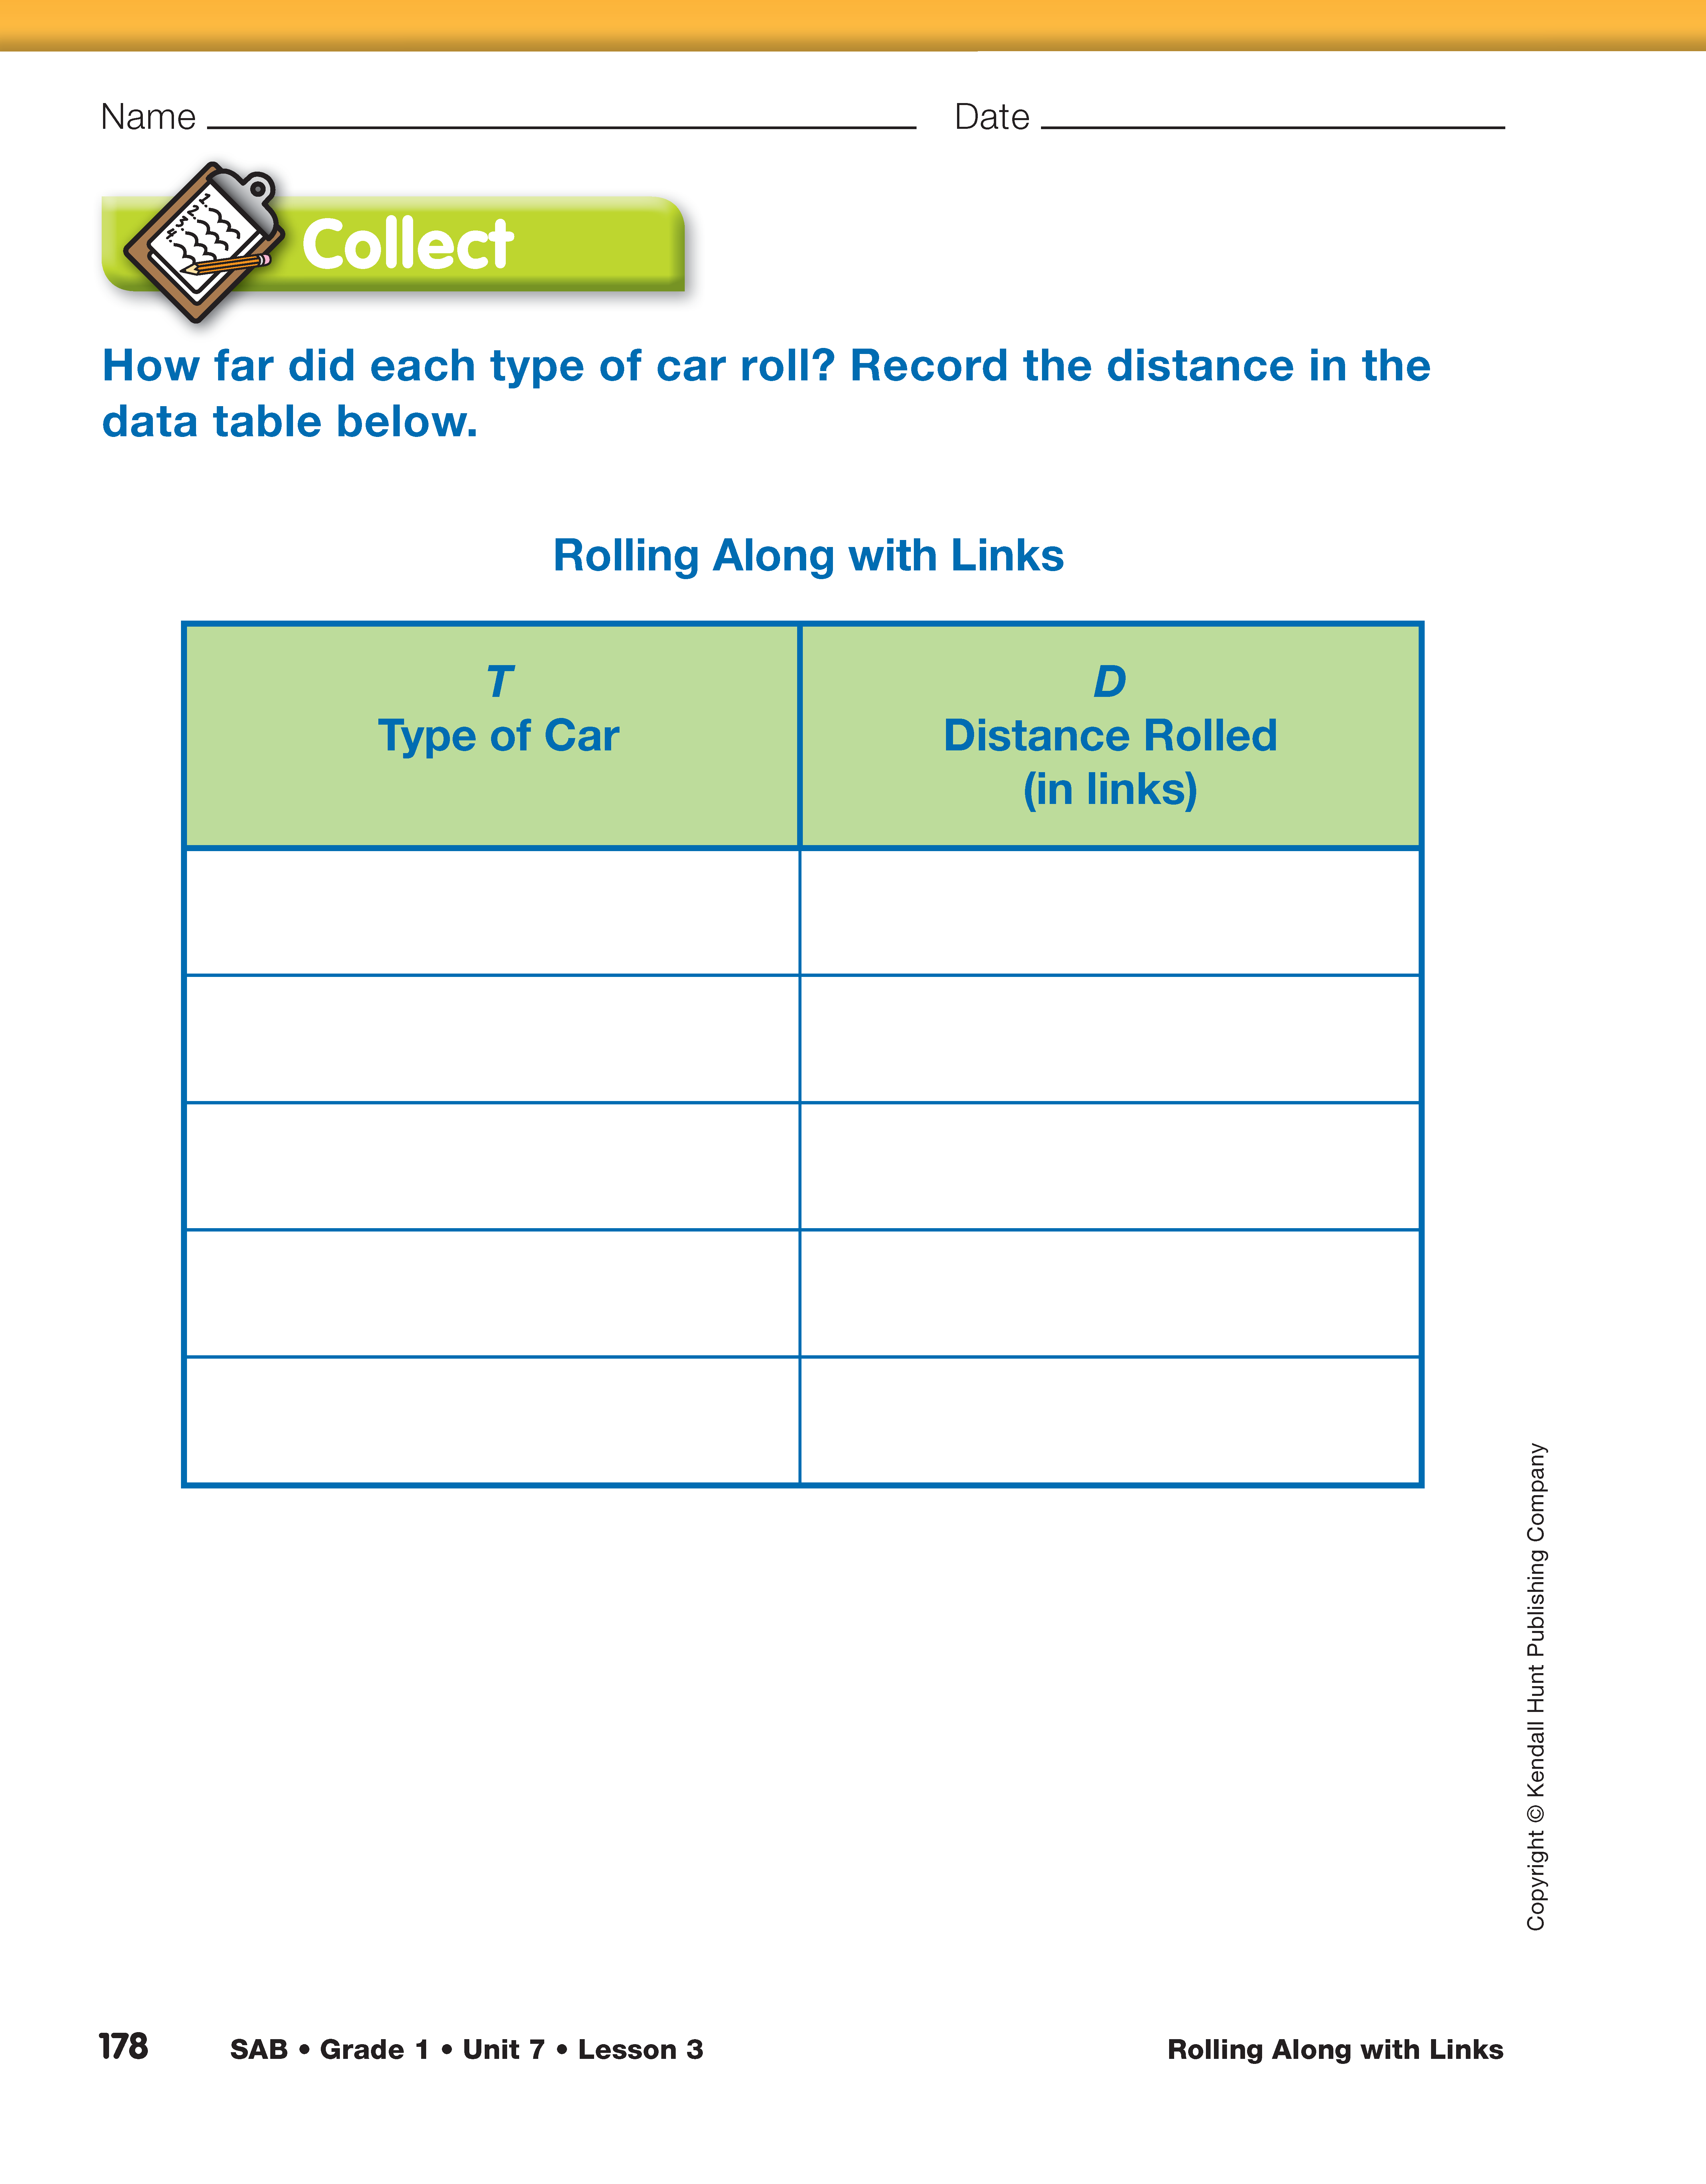
- How is the data table different from the graph? ("T
Type of Car" is on the bottom of the graph but in
the first column of the data table. "D Distance
Rolled" is written sideways on the side of the
graph. The data table has the names of the cars
and how far they rolled.)
- How can we show the same information that is in
the data table on the graph? (Write the names of
the cars under the bars. Make the bars go up as
far as the cars rolled.)
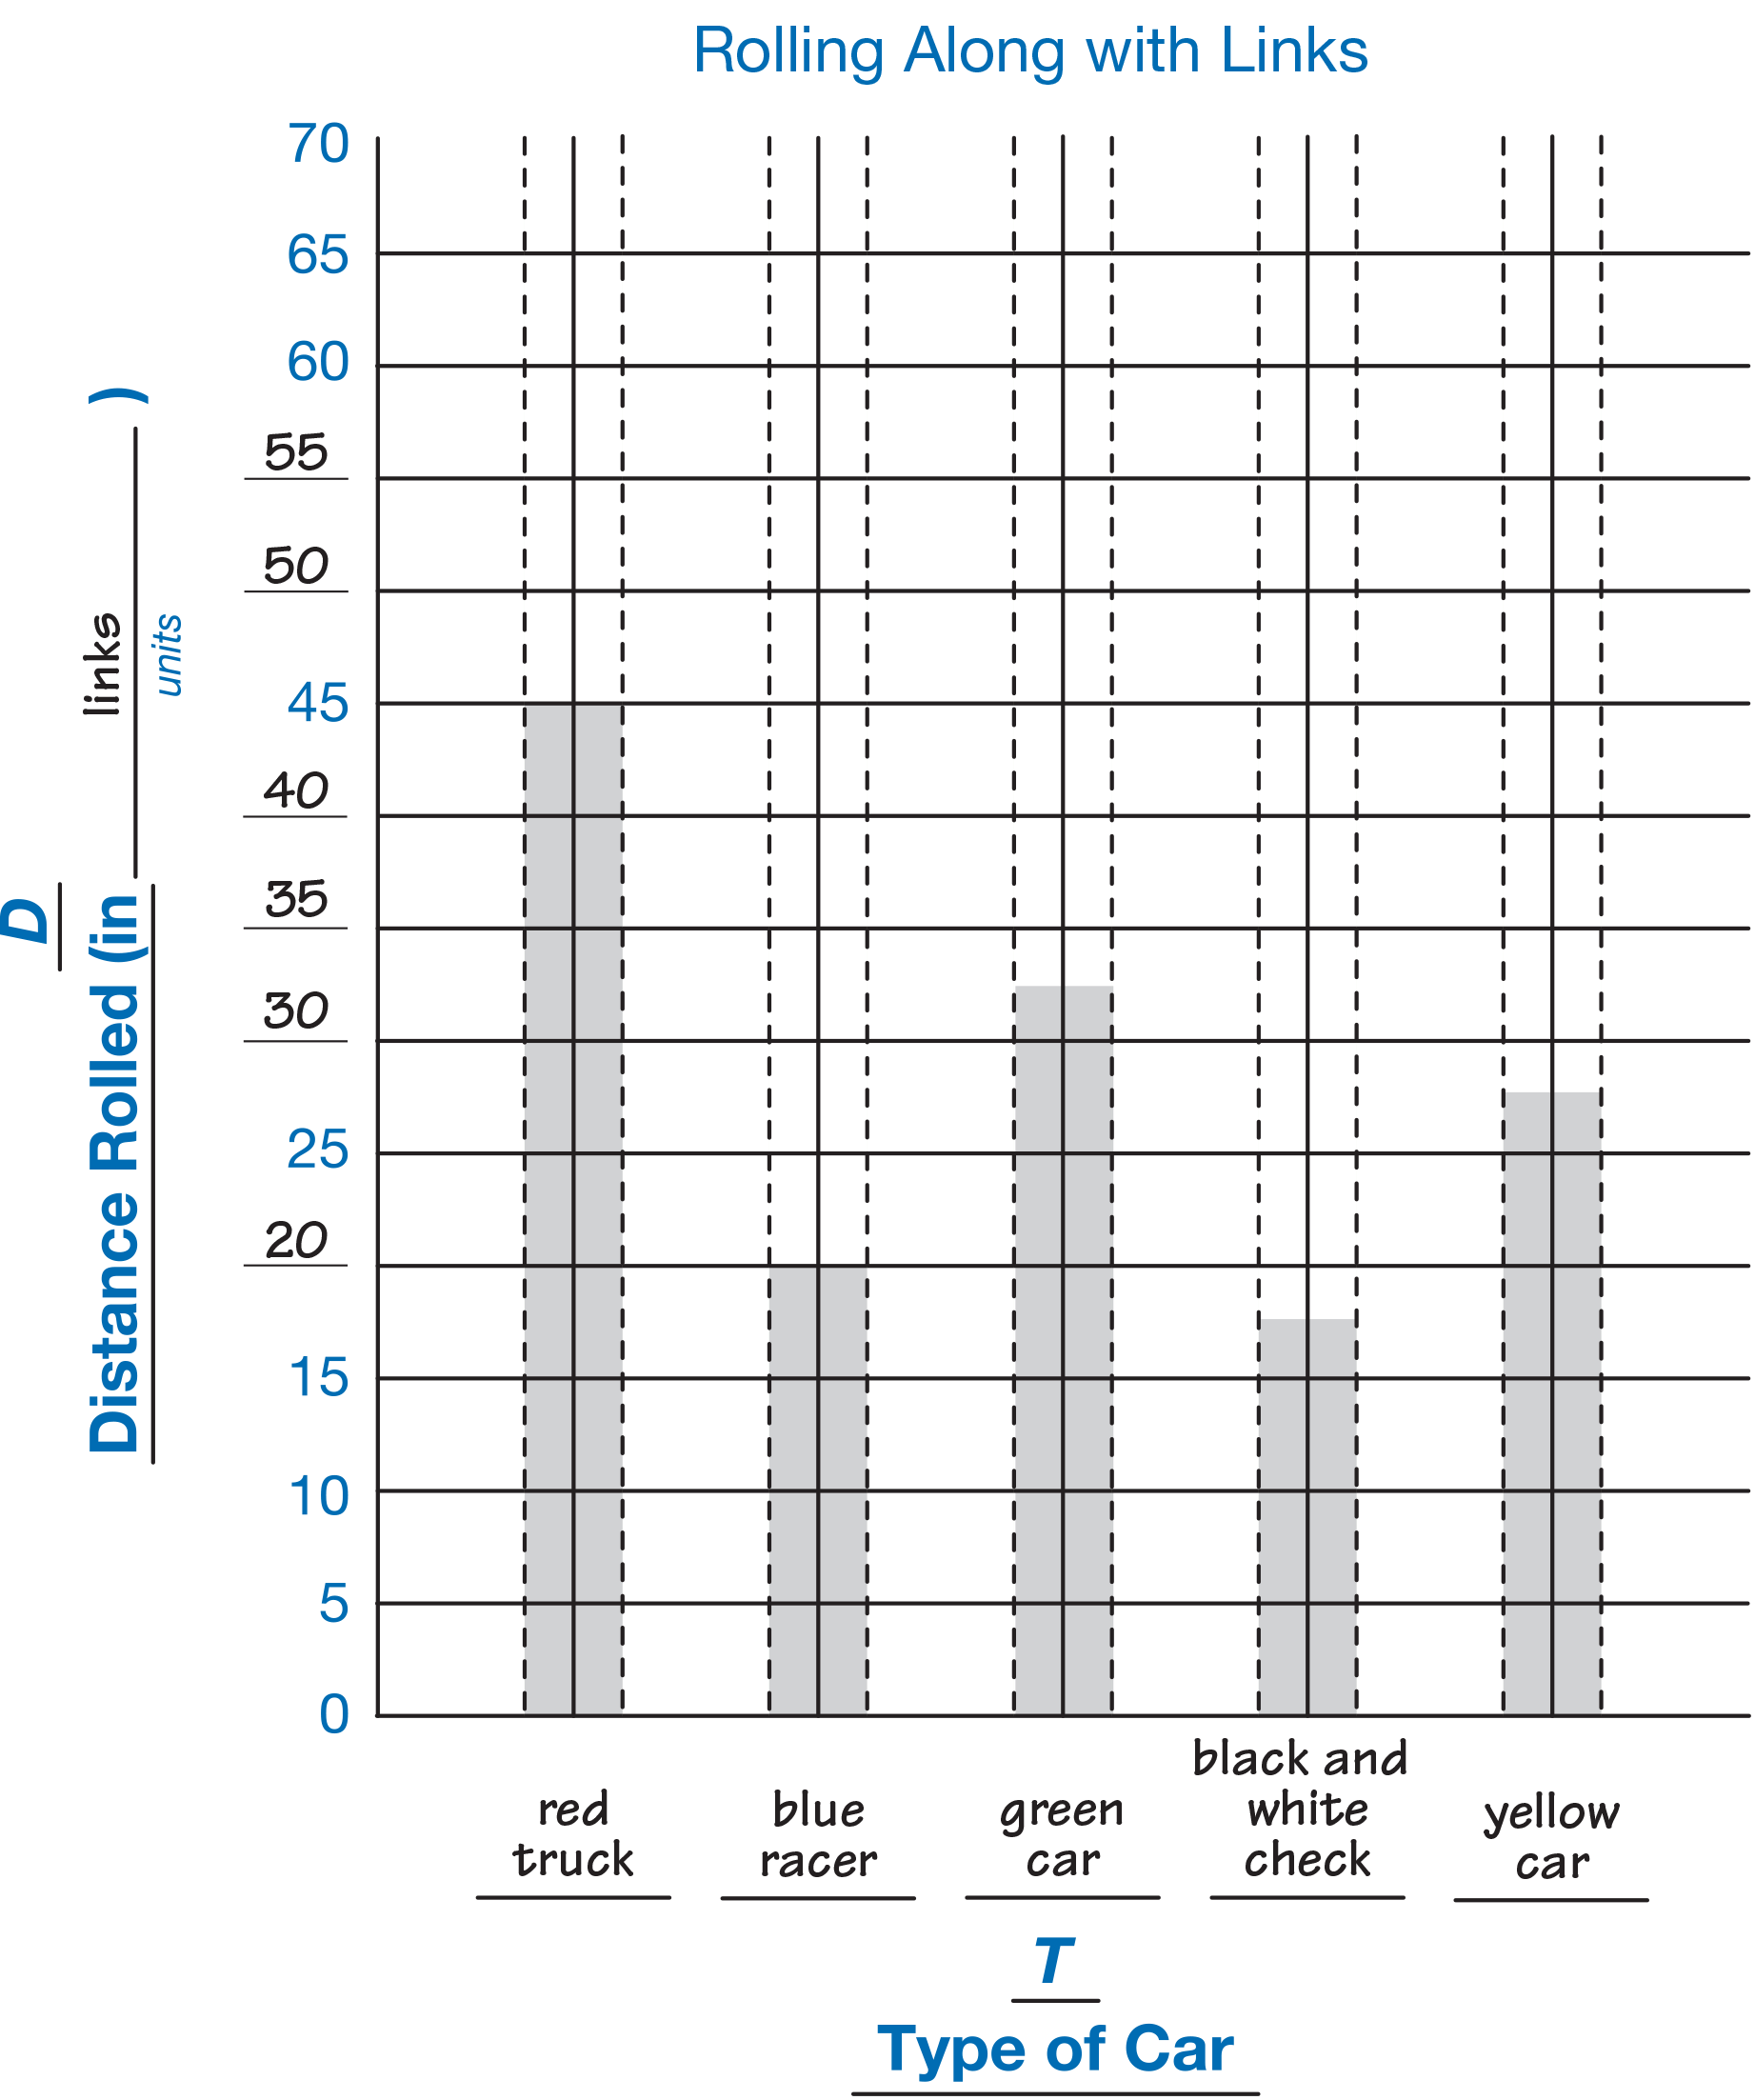
Using a display of the Rolling Along with Links bar
graph, point out that there are some numbers missing
on the vertical axis. Discuss what numbers students
should write.
- Look at the vertical axis on the side that is labeled
"D, Distance Rolled". How is it numbered? (It goes
by fives, but it's not done.)
- How can we figure out what numbers to fill in?
(We could skip count by fives and write them in
as we go.)
Lead the class in skip counting by fives to at least
70. Then direct students to write the missing numbers
in on their own.
Have the class decide how to draw the bars for two
types of cars. Some distances will not be multiples
of five. For example, a car may roll 43 links.
Encourage students to skip count by fives while you
point to the numbers on the vertical axis. When you
reach forty, pause and count by ones as you move up
the vertical axis. Draw the bar to meet your finger
(at roughly 43) and emphasize that 43 lies between
40 and 45. See the Sample Dialog for a discussion in
which the teacher guides the class in marking the
graph for a car that rolled a distance of 43 links.

In this Sample Dialog, the teacher guides the class in
marking a distance on the graph that does not lie on an even
multiple of five.
Teacher: Does anyone have an idea of how we would
record a distance of 43 links on our graph? There is no
43 listed.
Michael: It is more than 40.
Teacher: 43 is more than 40. Could we use the number line
to help us figure this out?
Ana: It is less than 45.
Teacher: It is less than 45 links. So we know it is between
40 and 45, and we can check on the number line to see
that this is true. [The teacher indicates the interval 40 to
45 on the class number line by holding up two meter
sticks.] Which number is 43 closer to, 40 or 45?
Several students: 45
Teacher: How does this help us with the graph?
Nila: So… is 43 in the middle?
Teacher: Do you mean between two numbers? [Nila nods.]
Can you come up and show us about where you would
draw 43 links on our graph? [Nila comes up to the display
and draws a line.] I see that Nila is drawing the top
of the bar between 40 and 45. She has found about
where 43 would be. If you look at the number line, you
can see that 43 would be about in the middle between
40 and 45.
Have student pairs complete their own graphs.
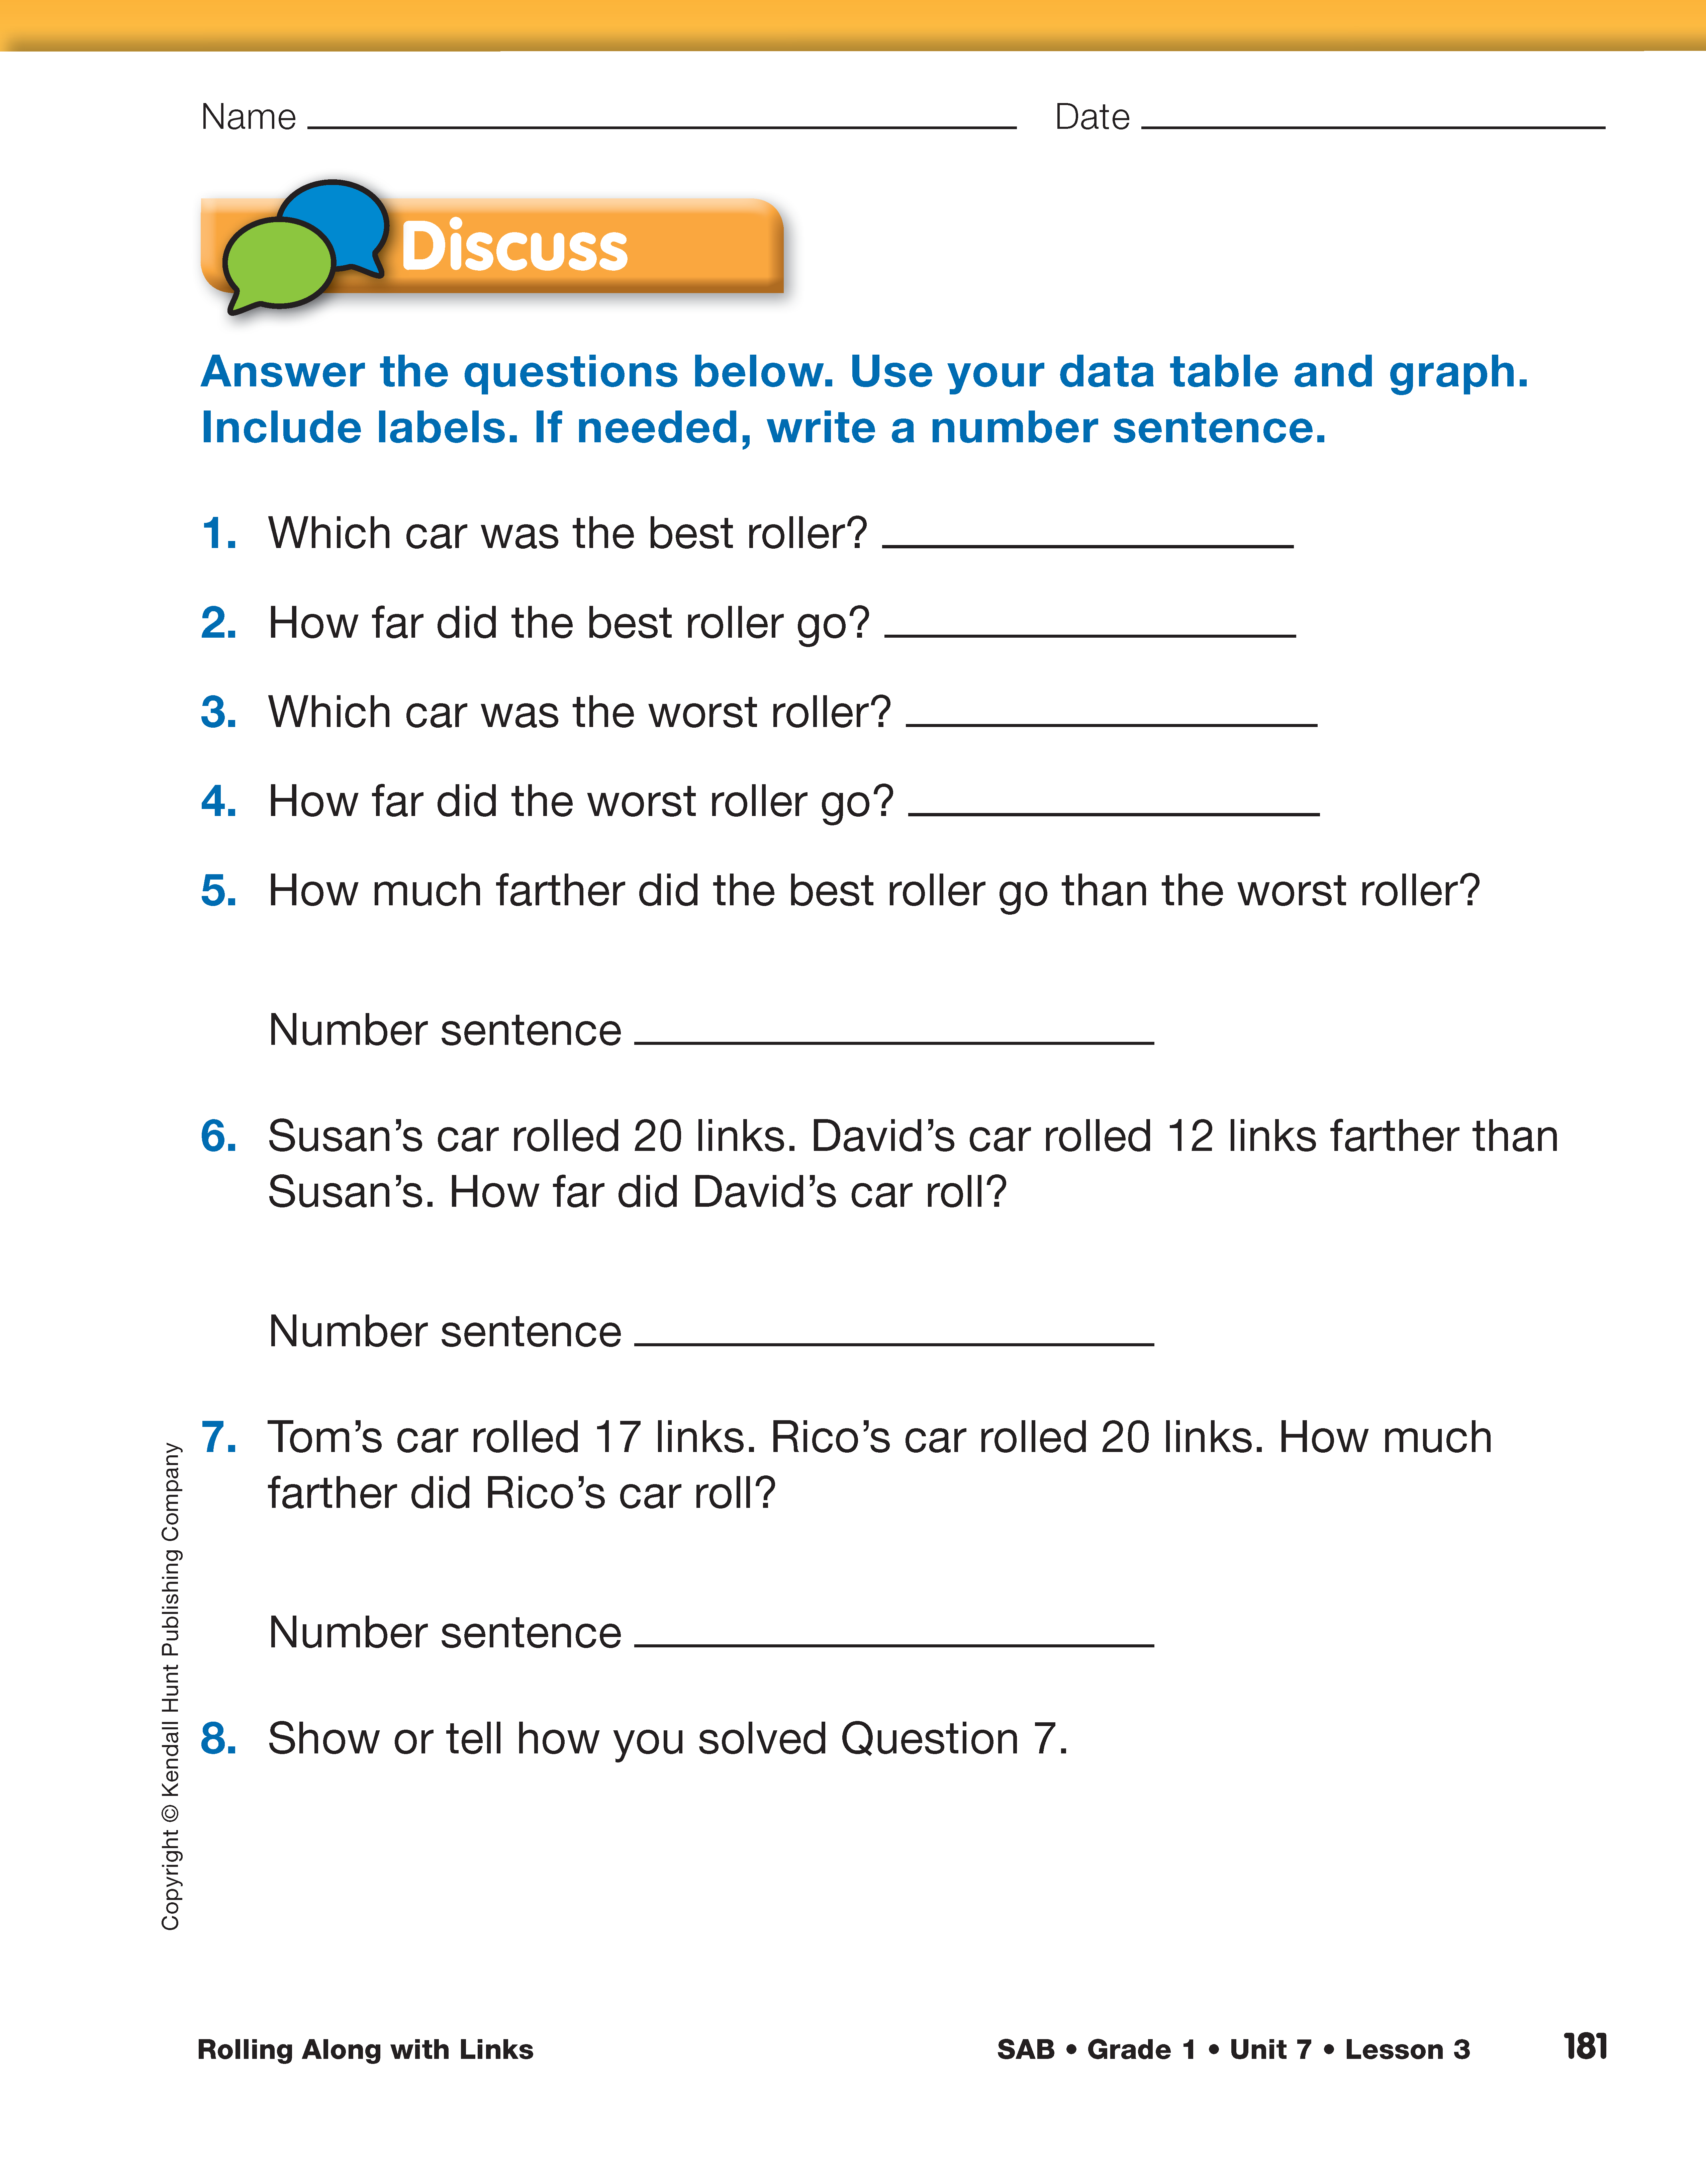
When students are done graphing, ask them to complete
Questions 1–8 on the Rolling Along with Links
pages. Remind them to include labels in their
answers.
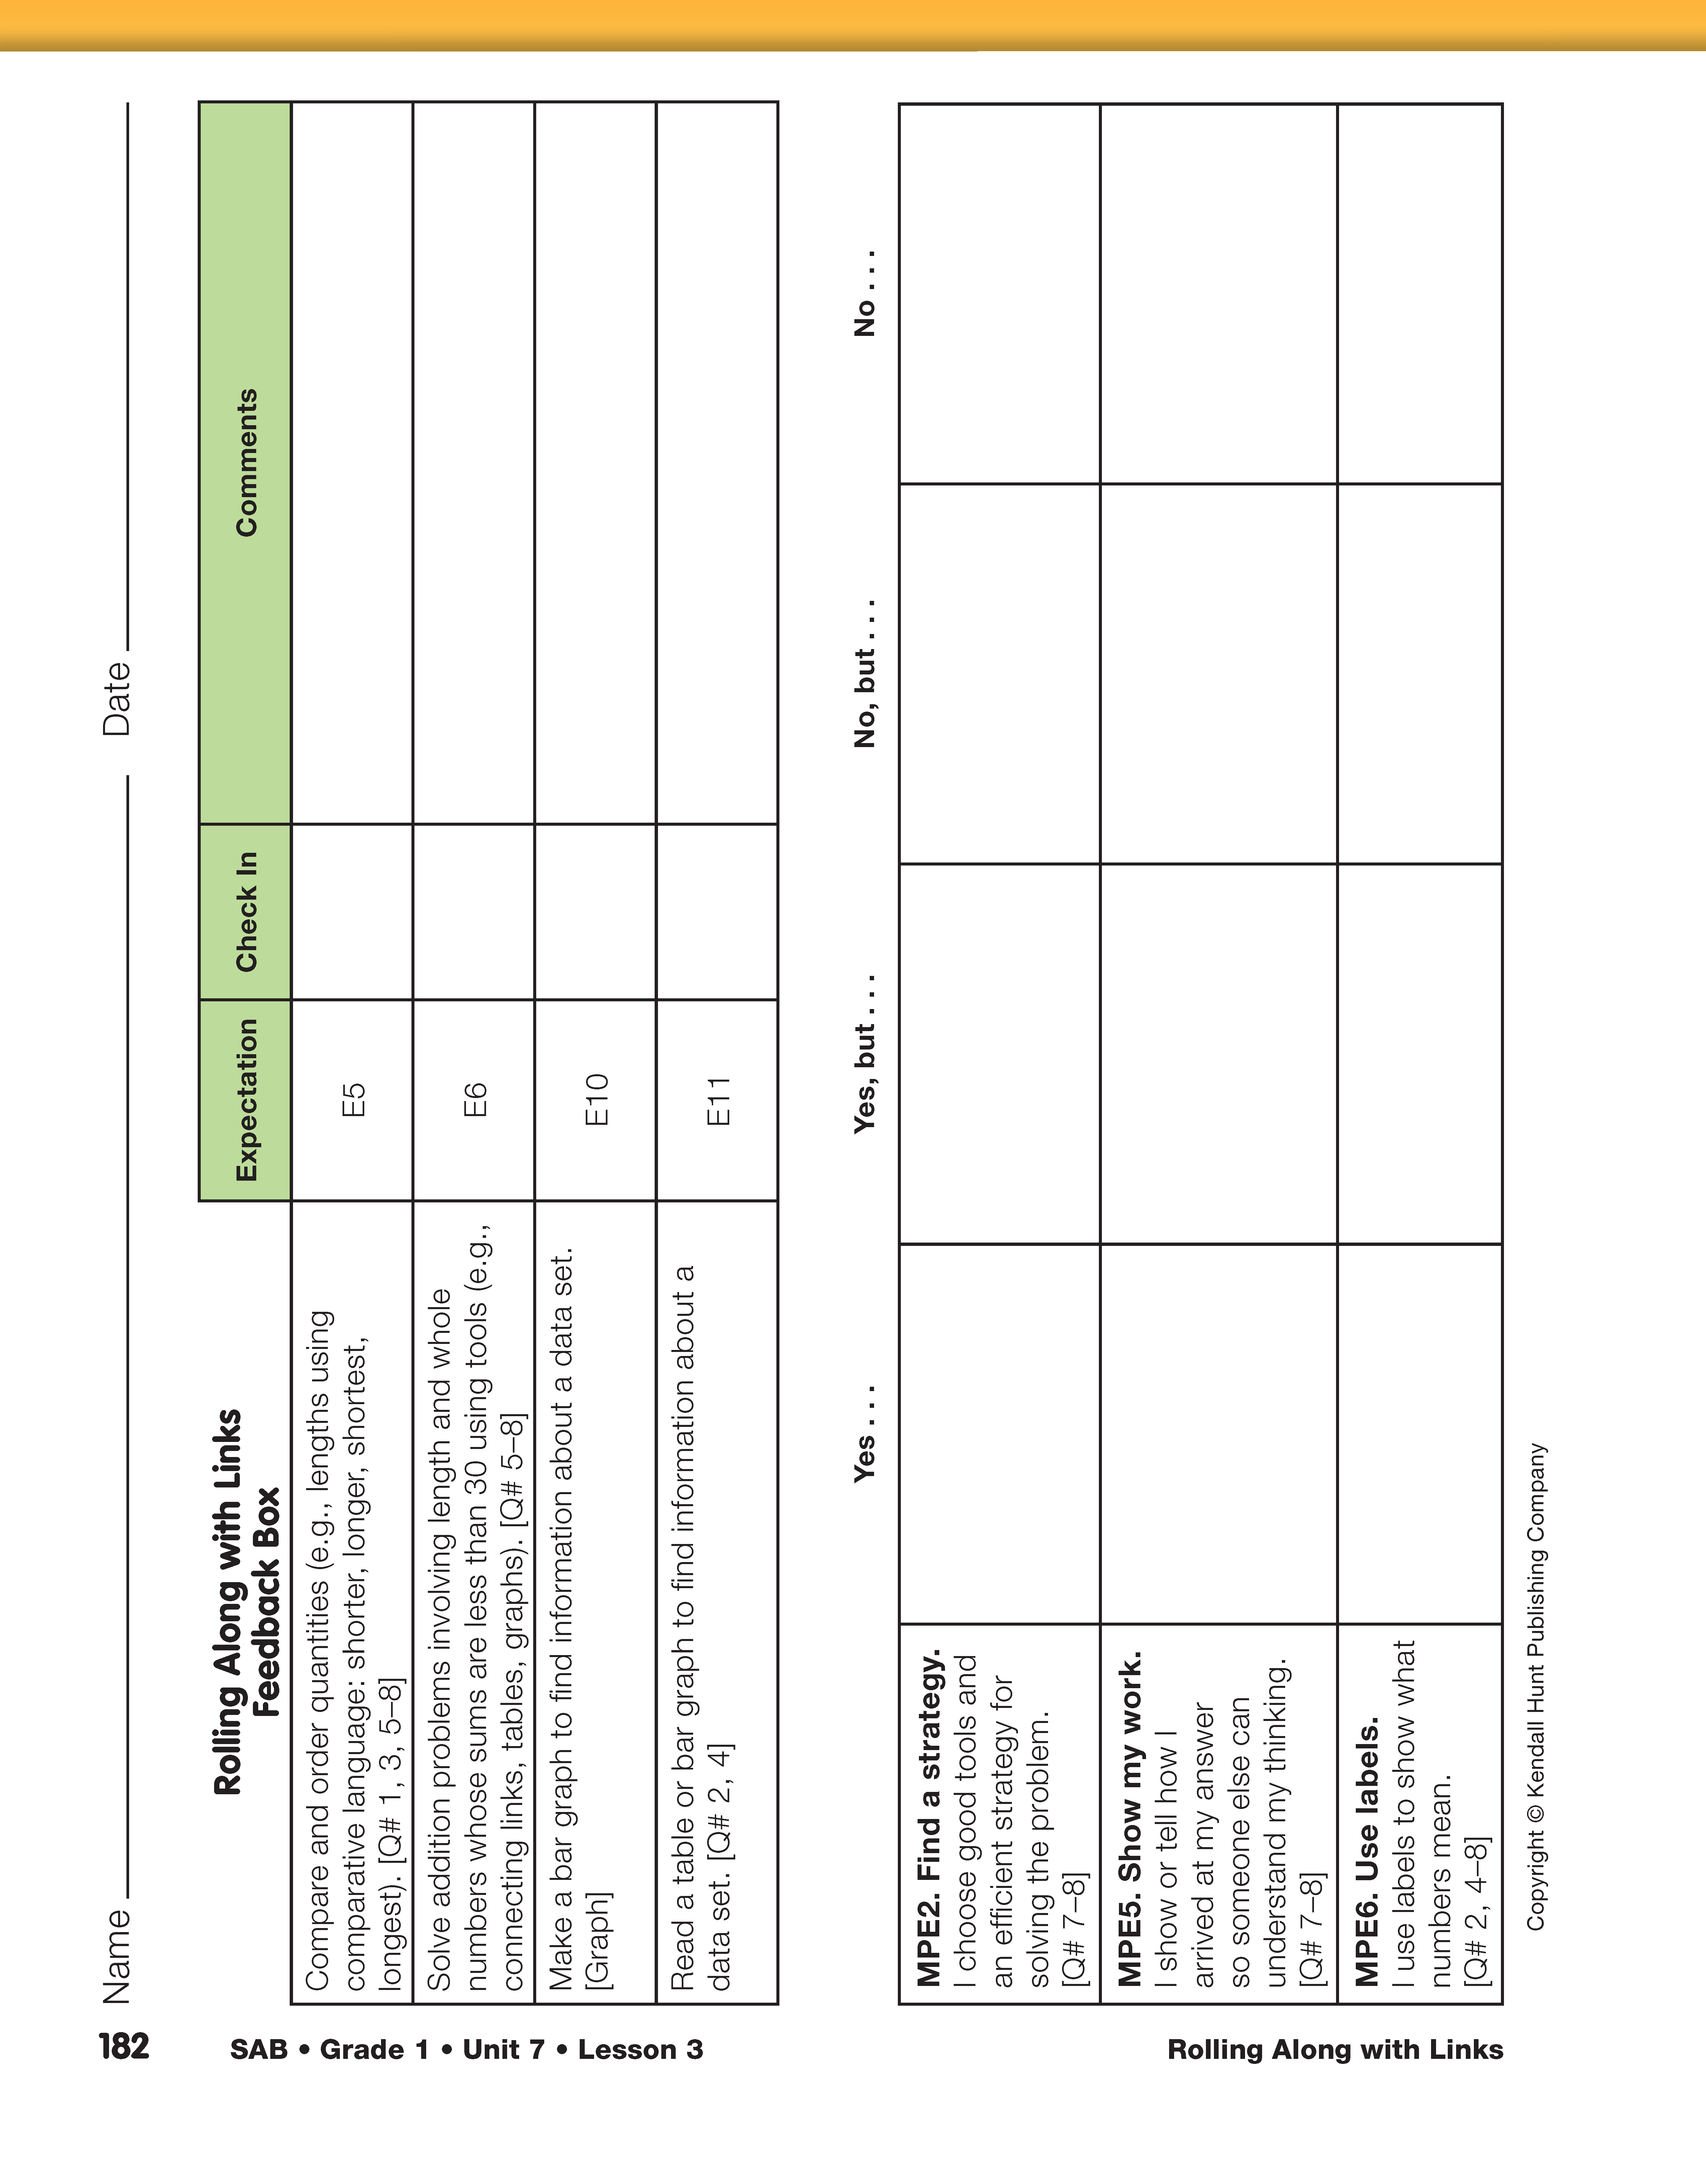
Use the Rolling Along with Links pages and the Feedback Box
in the Student Activity Book to assess students' abilities to
compare and order quantities [E5]; solve addition problems
involving length using connecting links, tables, or graphs
[E6]; make a bar graph [E10]; read a table or bar graph to
find information about a data set [E11]; find a strategy
[MPE2]; show work [MPE5]; and use labels [MPE6].