


Rolling Along with Links
Est. Class Sessions: 3–4Developing the Lesson
Part 3: Collecting the Data
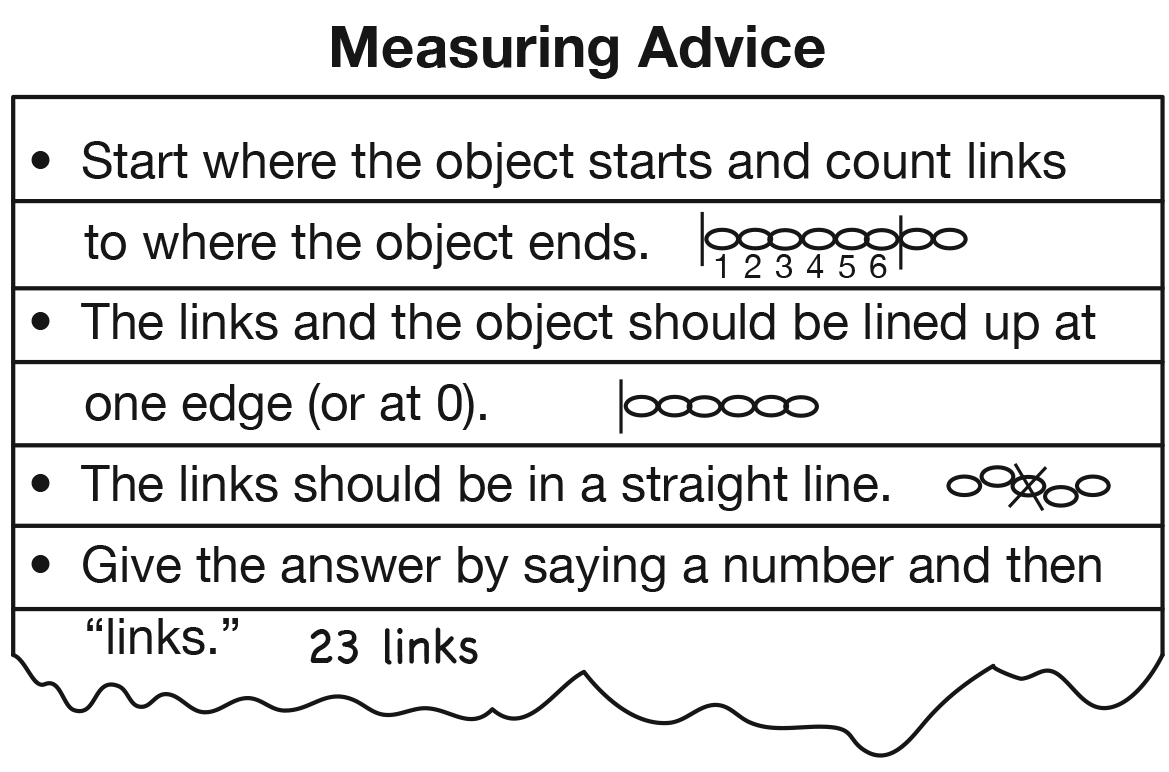
Find the Median. Explain that each student pair will roll one car down the ramp three times and record the measurements for each roll on their self-adhesive note. Students will then make a chain equal to the middle distance. Since five cars will be used, some pairs will use the same car. Review the Measuring Advice chart from Lesson 2. See Figure 5. Add any additional advice students might suggest for this lab. Remind students to hang their chains beneath the appropriate card, write the number of links on a self-adhesive note, and place the note below the chain. When all pairs have posted their chains with numbers, the analysis of the results can begin.

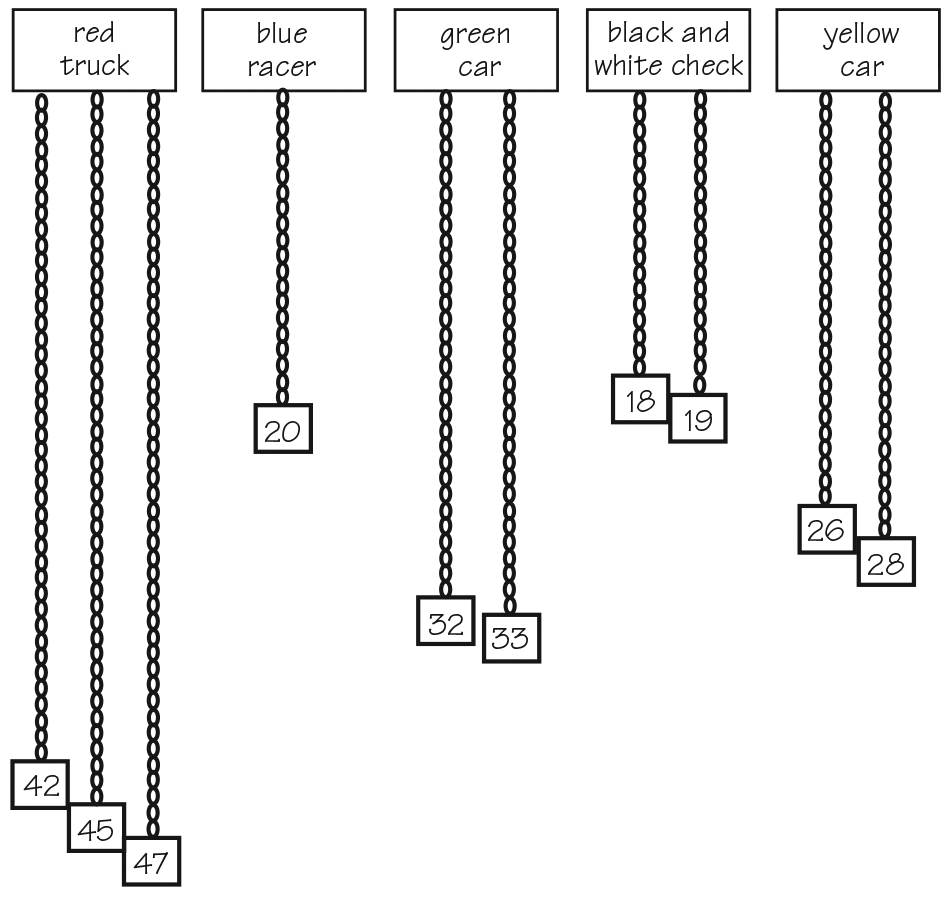
Look at the numbers and chains beneath each index card and ask students to help put the chains in order from shortest to longest. Guide students to understand that if the chains are in order from shortest to longest, then the number of links will also be in order from smallest to largest. See Figure 6. Emphasize that the class will do as scientists do and use the middle value (median) to represent the distance each car traveled.
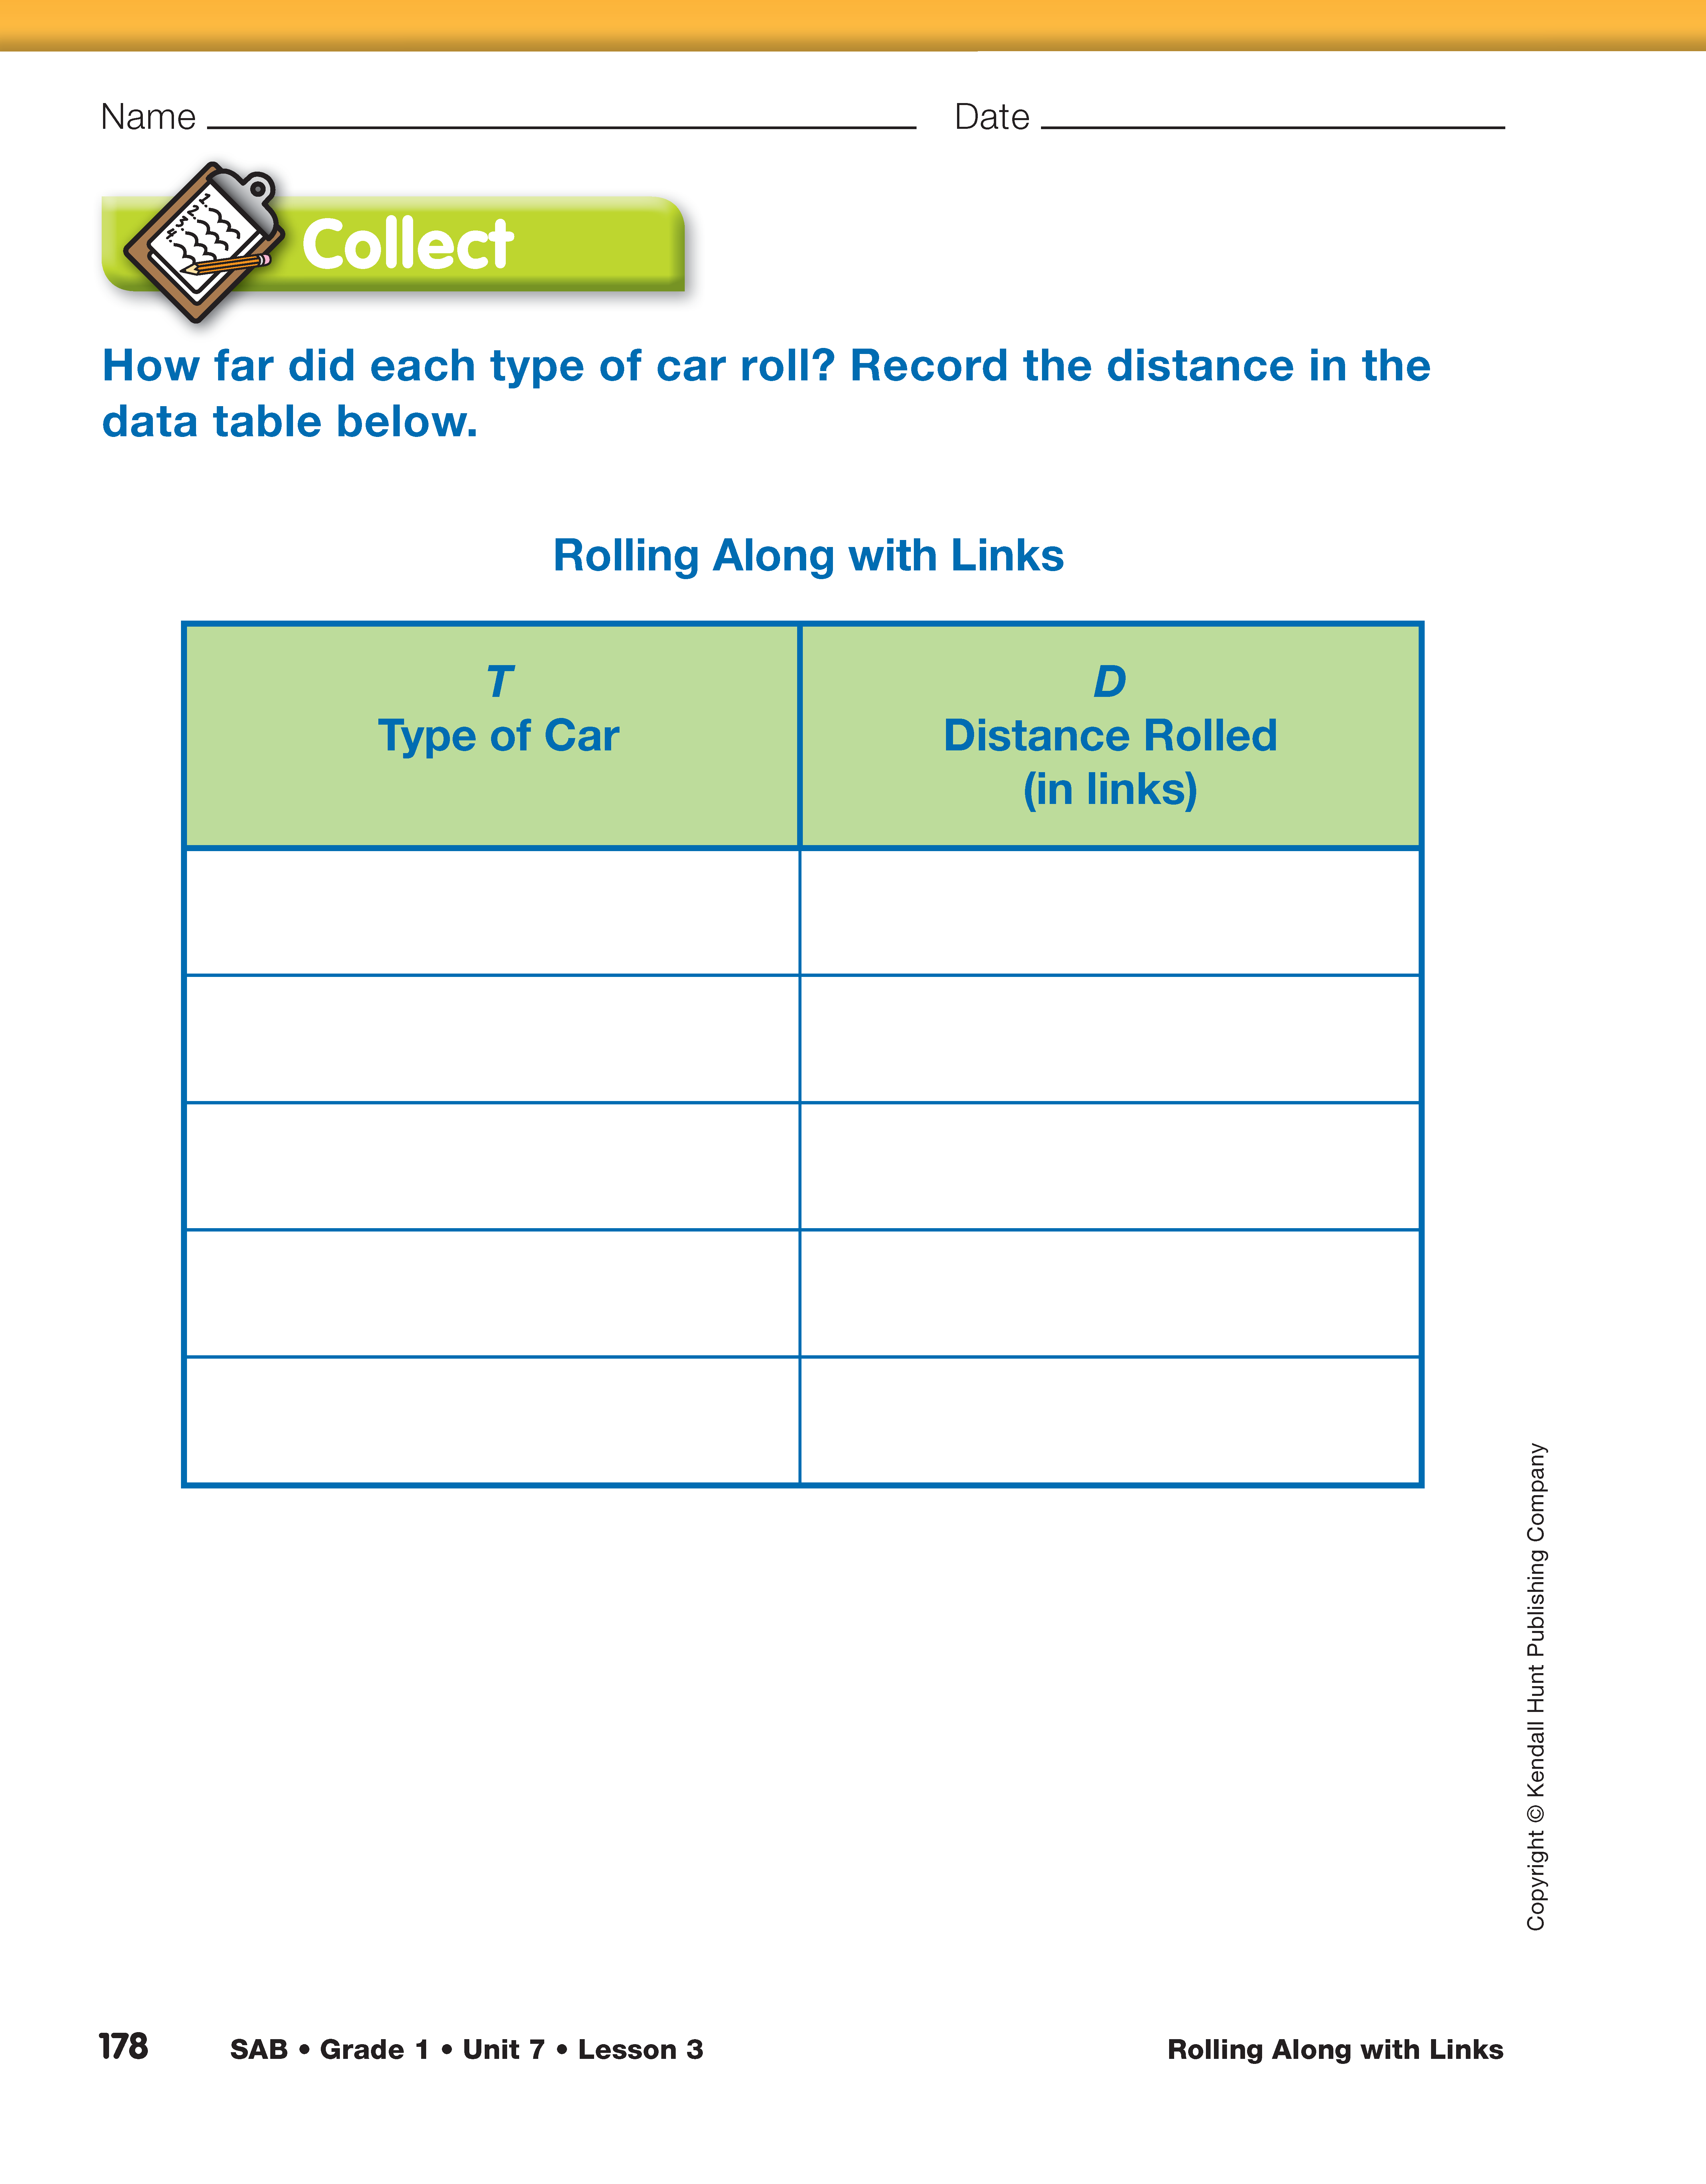
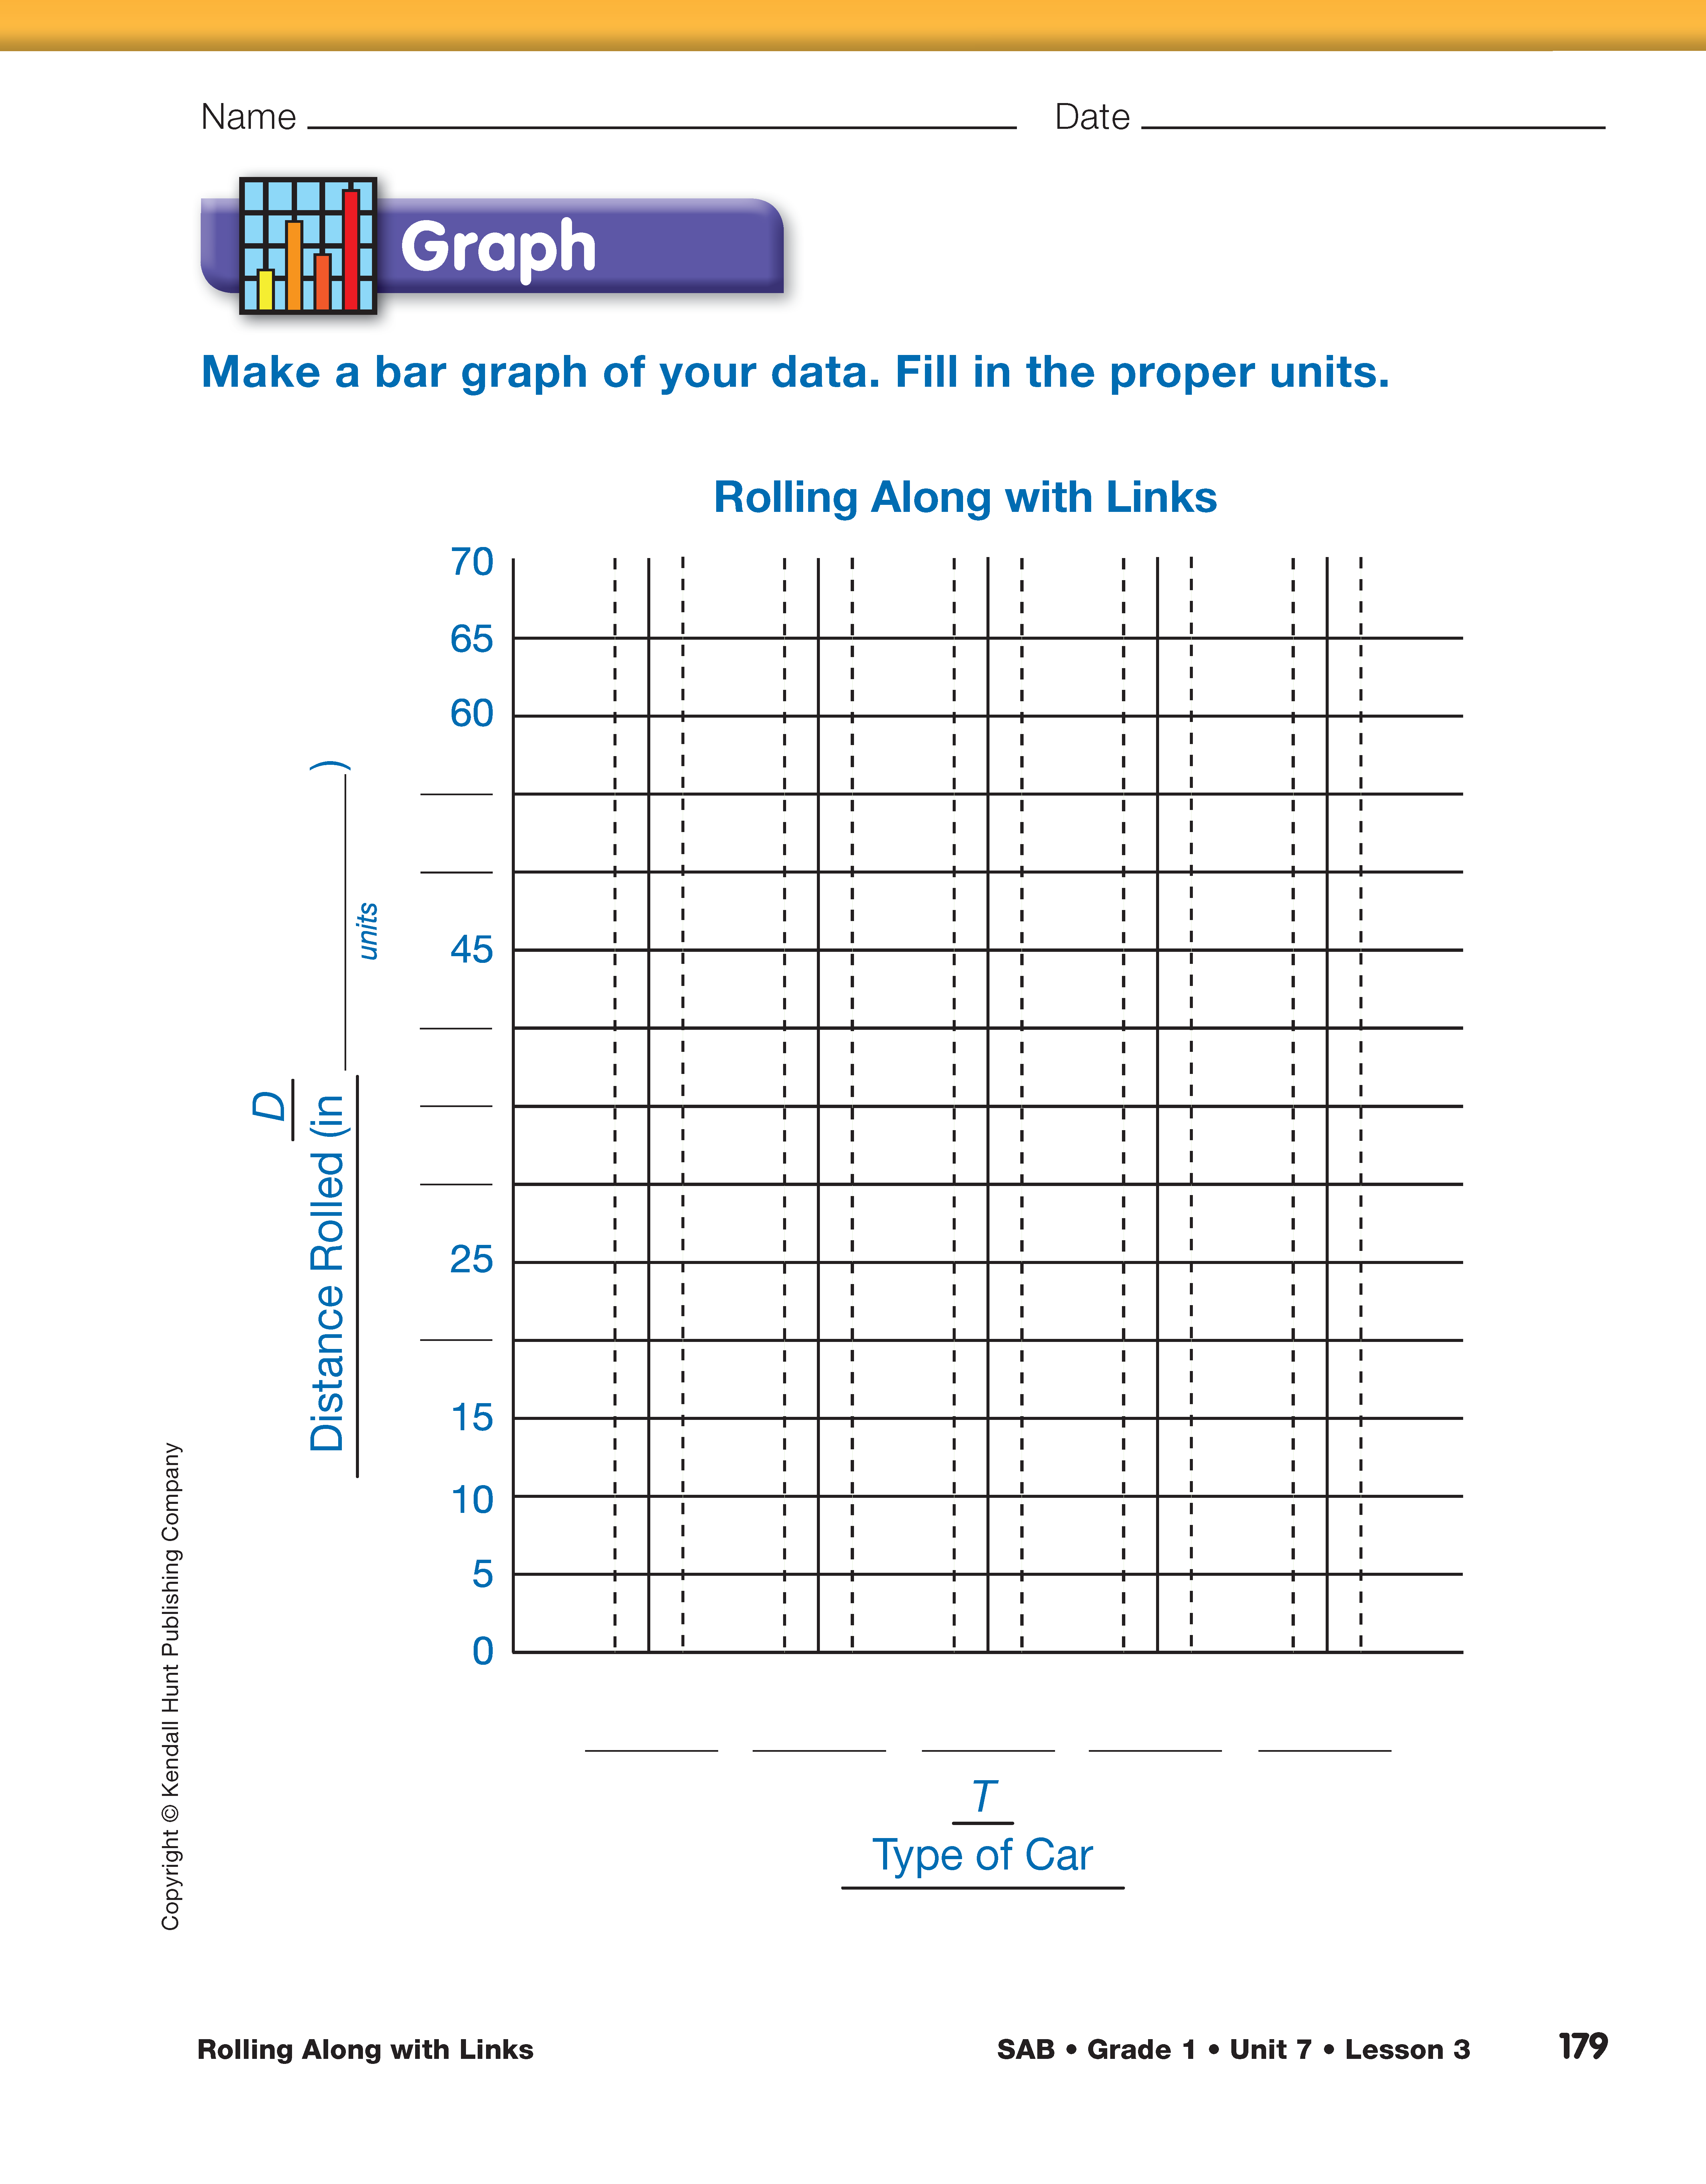
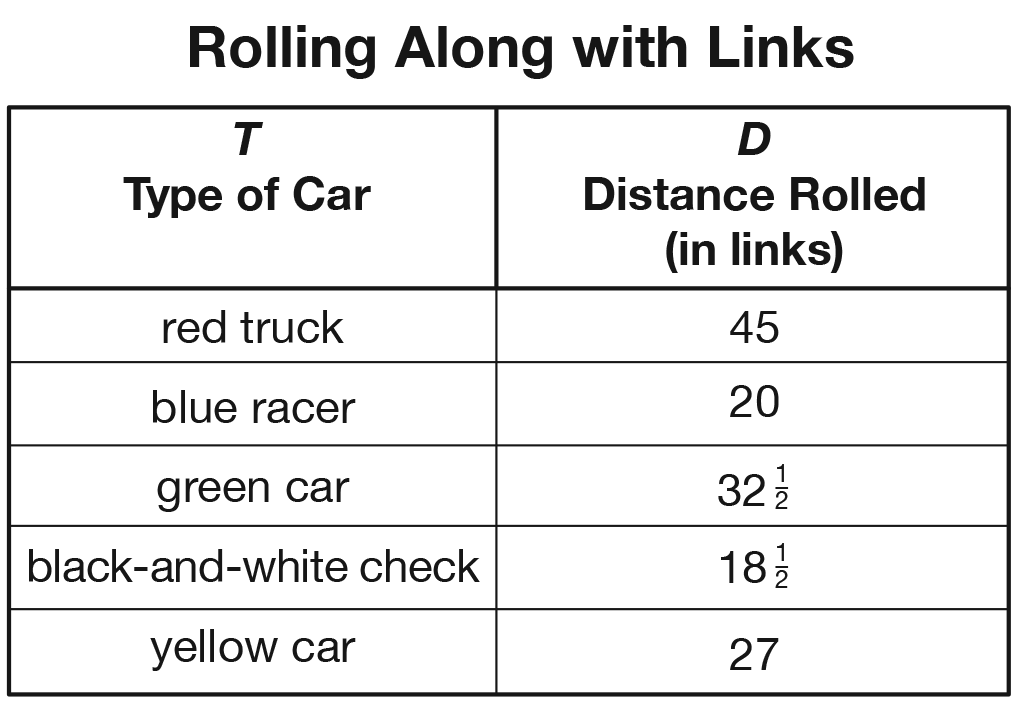
Record the Median Data. Use a display of the Rolling Along with Links data table as students work on their own copies. Ask students to record the middle number for each car in their data tables. If there are an even number of chains, have students help you choose an appropriate number. Generally, a number halfway between the two middle chains is selected. For example, the measurement recorded for the yellow car in Figure 6 should be 27 links. The measurement for the green car could be 32, 3212, or 33 links. See Figure 7 for a sample data table.
If there is a large difference among the chains for a single car, ask students what they think might have happened. For example, one trial might give a much smaller result than the others if the car hits the side of the ramp. They could repeat the trial or ignore the bad data.