Stencilrama
Est. Class Sessions: 3Developing the Lesson
Part 2. Your Stencil Data
Make a Stencil. In Question 11 in the Student Guide, students are directed to make their own stencil using the steps outlined by Liz and Diana earlier in the lesson. Share the design and stencil examples that you have gathered to inspire students. Give each student pair a 3 × 5–inch index card to make a stencil. Remind students to keep the stencil shape simple.
Draw a Picture. Using the sample stencil you prepared, model the procedure of making a border across a long piece of paper. Use a stencil five times, marking the paper at the edge of the stencil. Point out those variables that need to be kept fixed. Tell students they will compare the number of stencils and the length of the border by measuring the length in inches of one, two, four, and five stencils just as the girls did in the vignette in the Student Guide.
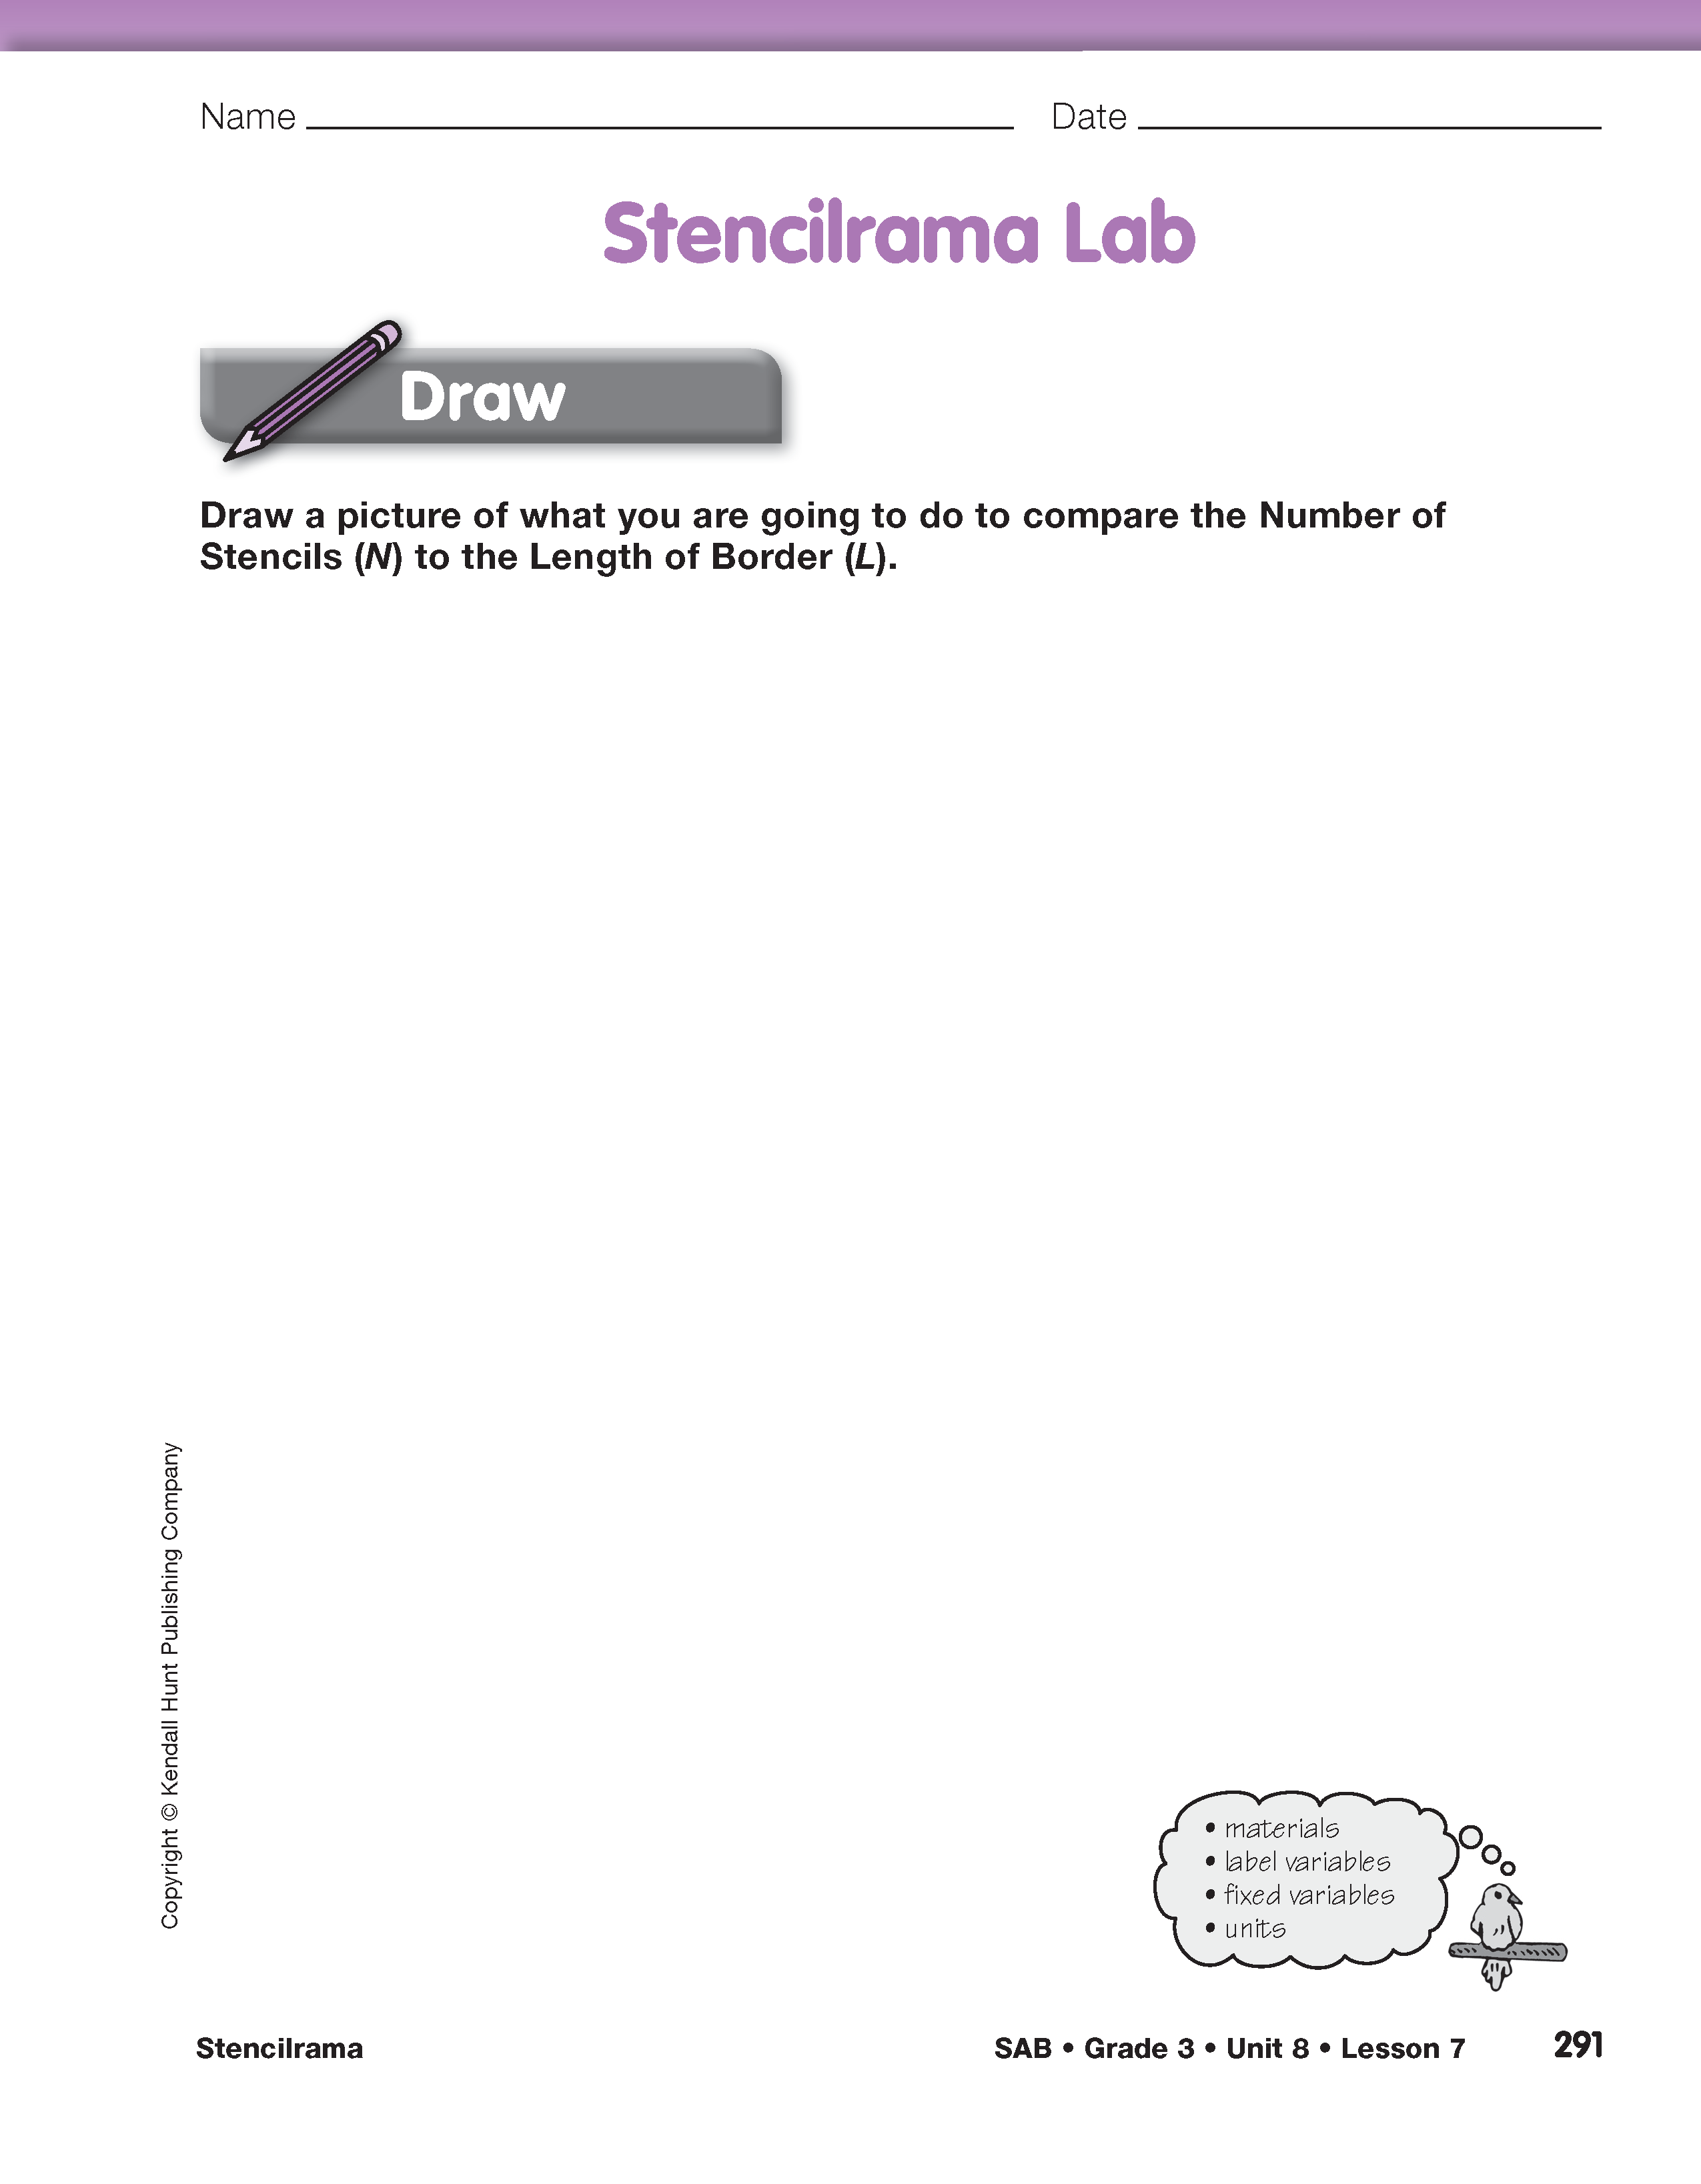
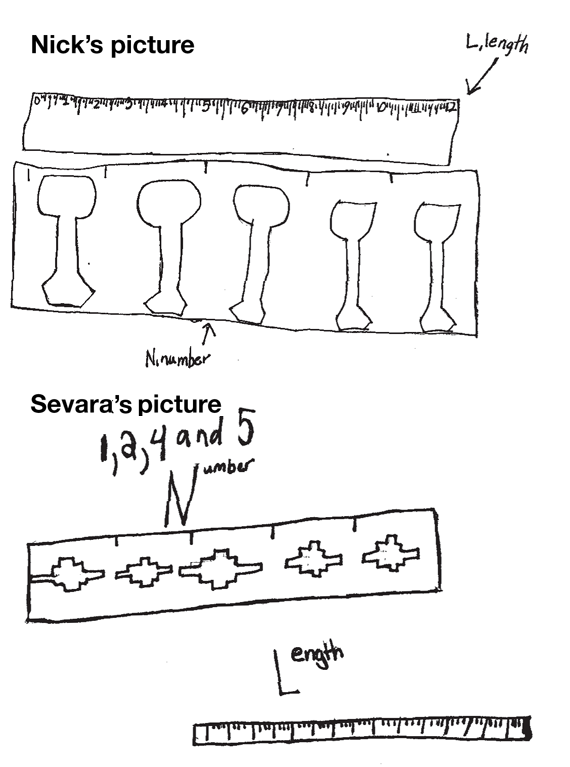
Ask students to describe what they are going to compare by drawing a picture on the Draw section of Stencilrama Lab page in the Student Activity Book. Students should label the variables and show the procedure for making and measuring the border. Two student drawings are shown in Figure 5. In both drawings, students clearly labeled the variables of length and number. Students also indicated they will make small marks after they use the stencil each time so they will not leave any gaps between each stencil pattern. Nick's drawing shows that he will hold his index card vertically each time he uses the stencil. Sevara's drawing shows she will always hold hers horizontally.
Review student drawings as you circulate. Check to see that students:
- label the variables;
- show the procedure for making and measuring the border;
- indicate that the unit of measure is inches.
Make a Stencil Border. Students are now ready to make a border with their stencil. Distribute inch rulers, markers or crayons, and the long pieces of paper you prepared for each pair of students. Direct students to use their stencil to make a border of five stencil patterns. You may need to revisit Liz and Diana's procedure as described in the Student Guide.
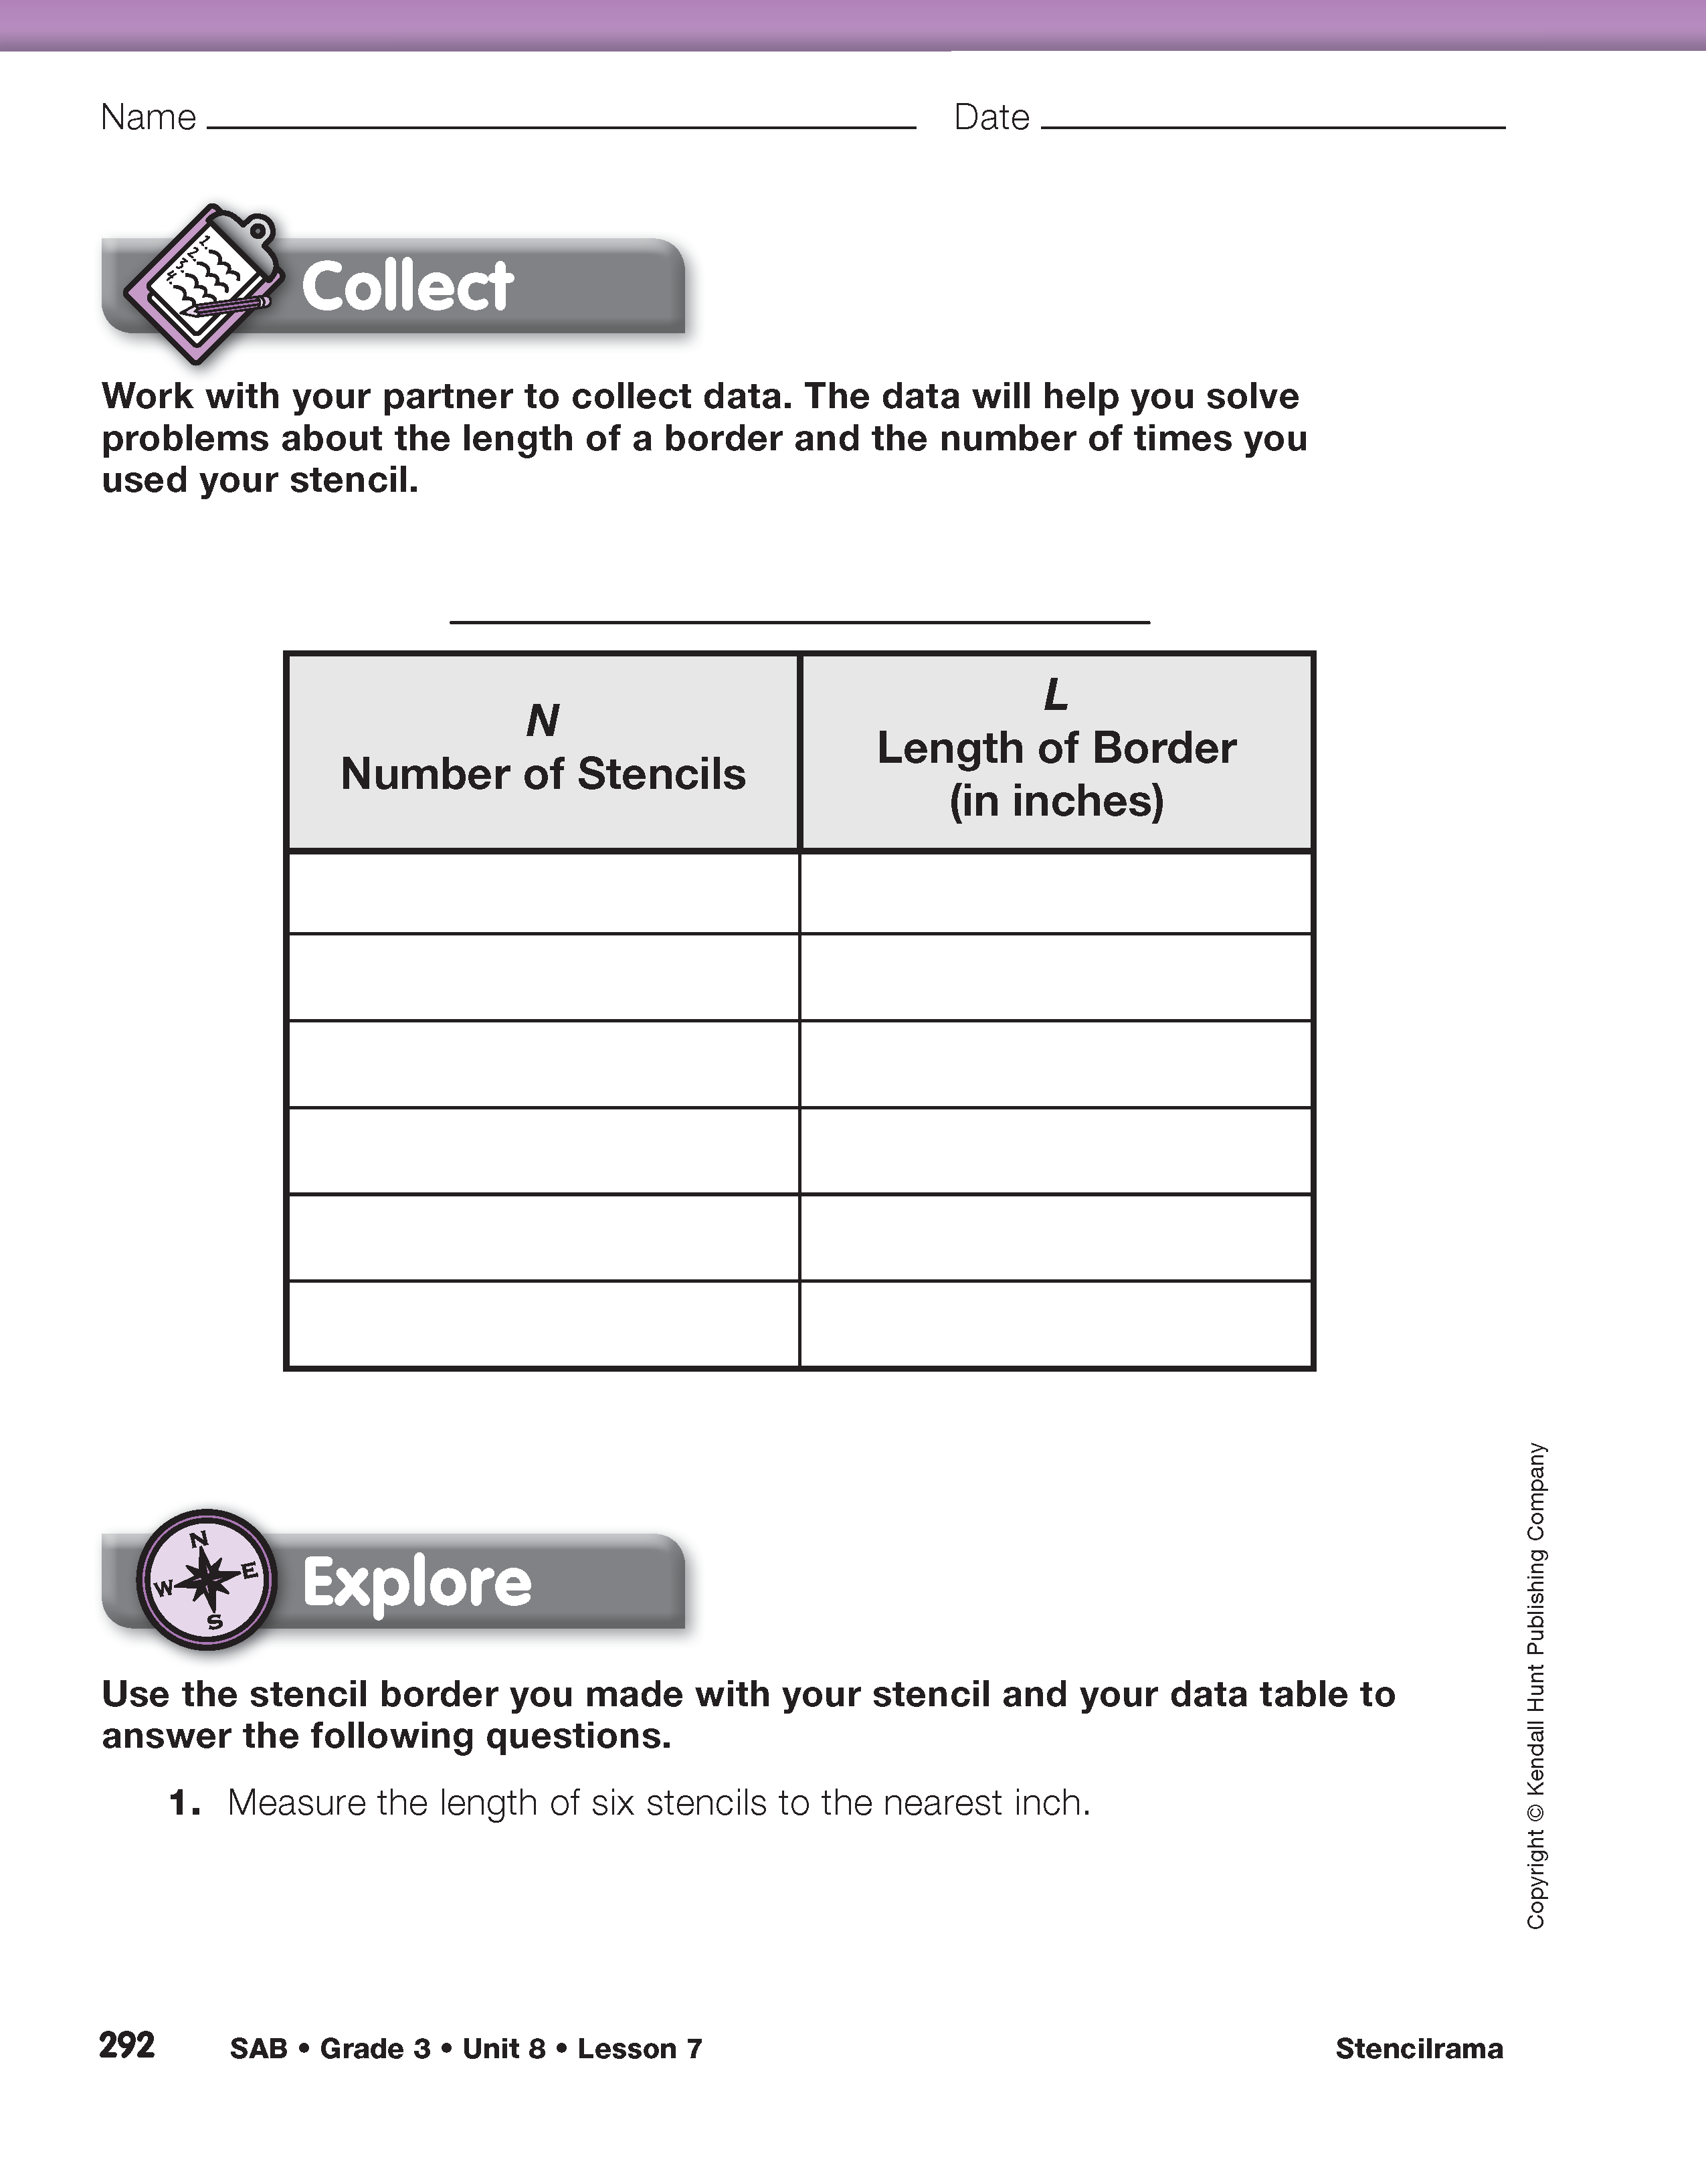
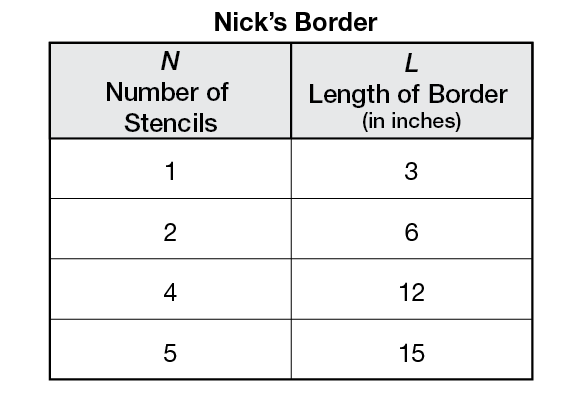
Collect Border Length Data. After students have made their border, they are ready to measure the lengths of one, two, four, and five stencils. Ask students to record their measurements on the data table on the Stencilrama Lab pages in the Student Activity Book. There are two extra rows on the data table to give students an opportunity to collect other data if they wish. A sample data table is shown in Figure 6. The stencil used to make the border represented in this sample data table is placed on the paper vertically. The data will not always be this exact. Measurement error or stencil placement error may lead to some variation in the measurements.


Show How to Reason from Data. Students are now ready to look for patterns in their data to make predictions and solve problems. Ask students to work with their partner to complete Questions 1–5 in the Student Activity Book. Remind students to use the strategies they discussed and displayed earlier in the lesson. With these questions, students will show different reasoning strategies to find the length of a border. While students are working, determine if students oriented their stencil along the 3-inch side or the 5-inch side of the index card. As students have completed these questions, pair them up with other students who oriented the stencil the same way and ask these students to compare their solutions and reasoning strategies. Ask each group to pick their favorite strategy used in one of the problems to share with the rest of the class. As each group shares their favorite strategy compare the strategies.
Ask:
Solve Problems Using Data. Working with their partner once again, ask students to answer Questions 6–10 in the Student Activity Book. Circulate among the students listening for reasoning strategies and providing support to students as needed.
Ask:
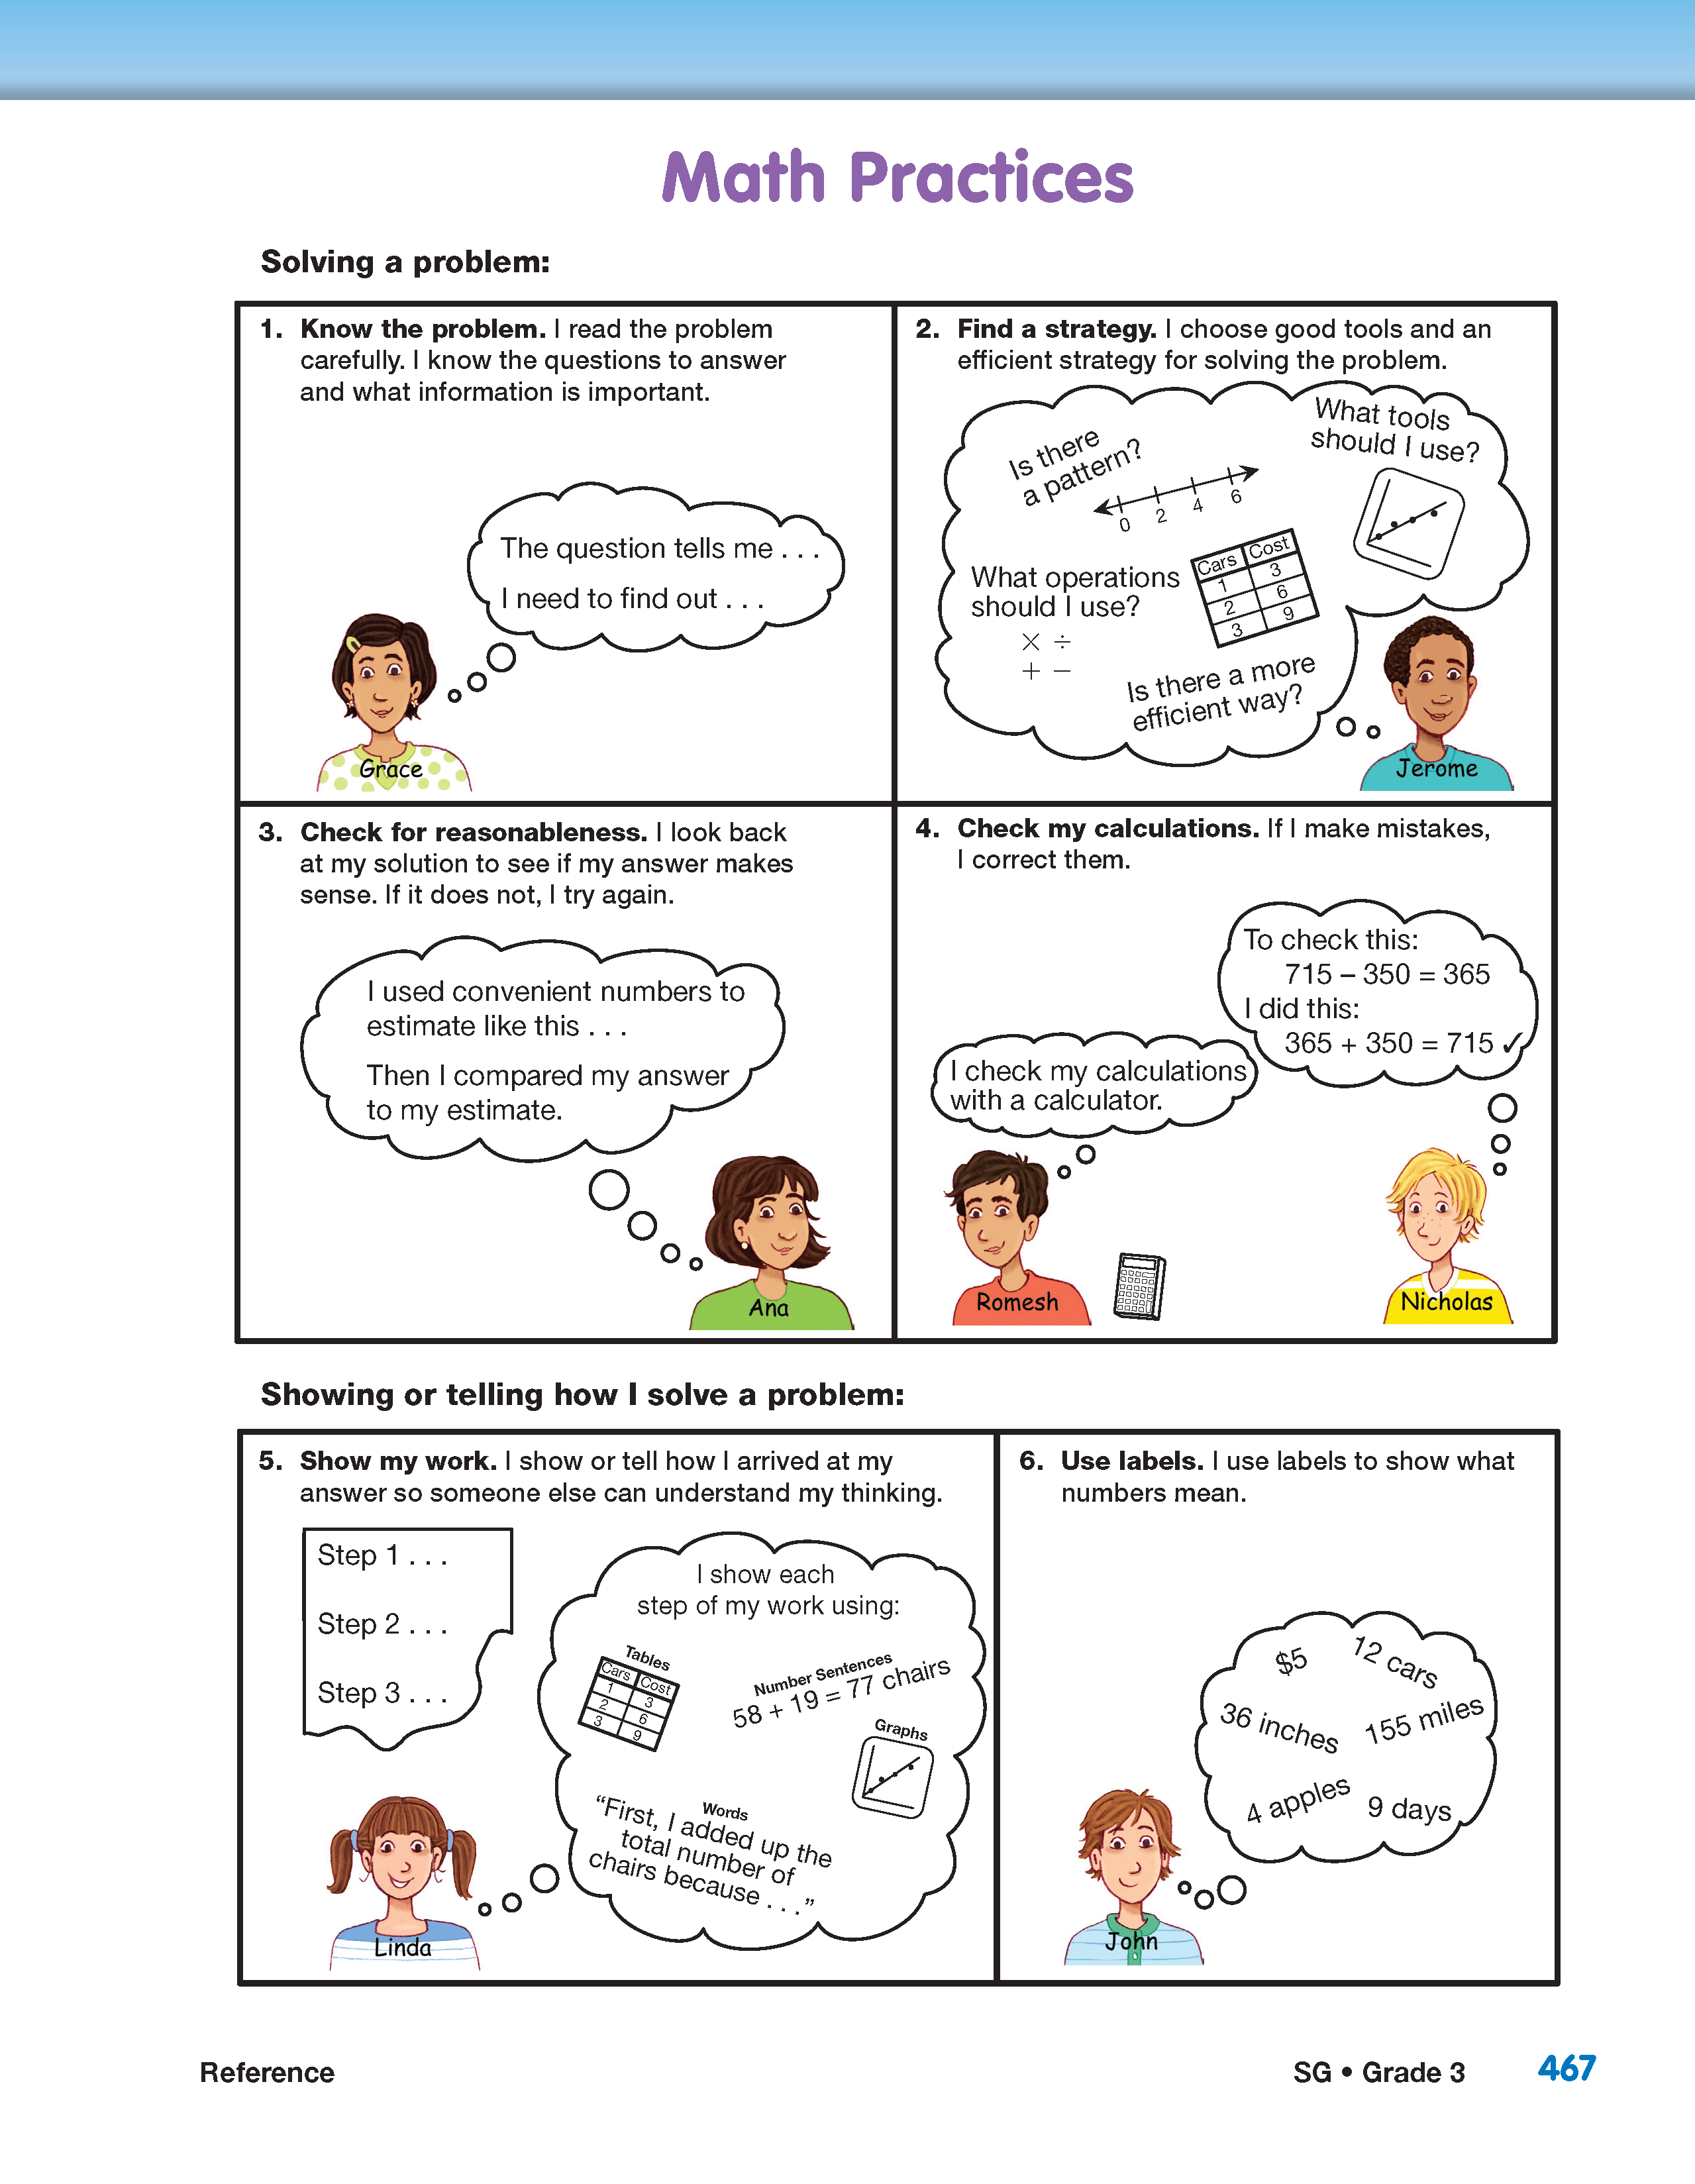
After most students have completed Questions 6–10, display the Math Practices page in the Student Guide Reference section.
Ask:
Ask students to now look back over Questions 6–10 and check to see if their answer is reasonable [MPE3]. Prepare to gather students' ideas on a piece of chart paper.
Ask:
Now that students have a variety of strategies to solve multiplication and division problems ask students to answer Questions 11 and 12 with a partner. In Question 11 students are asked to determine the number of stencils needed to make a border for the front of their desk. Since student desks in a class are generally consistent, students can compare solutions and strategies to check that their answers are reasonable. In Question 12 students choose a location for a border and will need to show how they checked for reasonableness.
Remind students to use the Math Practices page in the Student Guide Reference section as they work. Provide time for students to talk about their solutions before they begin writing. See the Meeting Individual Needs boxes for strategies you can use to get students talking about their problem solutions.