Stencilrama
Est. Class Sessions: 3Developing the Lesson
Part 1. Liz and Diana's Stencil Border Data
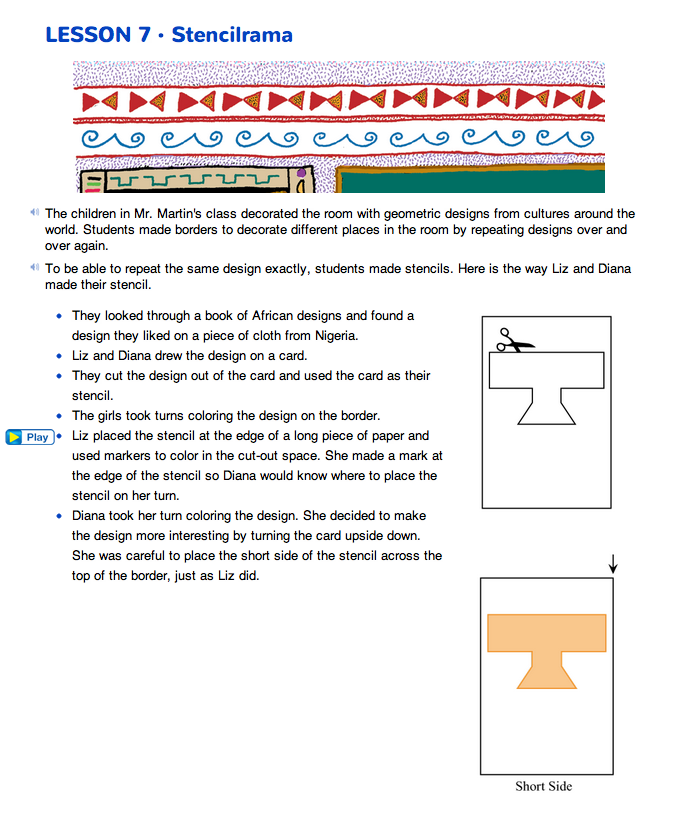
Introduce Stencilrama Context. Refer students to the Stencilrama pages in the Student Guide. These pages begin by describing the process of making a border using stencils. Two girls in a classroom choose a design for a stencil, cut the stencil, and take turns using the stencil to start their border. The class wants to make borders of different lengths, so they decide to investigate how the number of times they use a stencil affects the length of the border. They collect data and record it in a data table. As you read, demonstrate how to make a stencil using the sample stencil. See Materials Preparation.
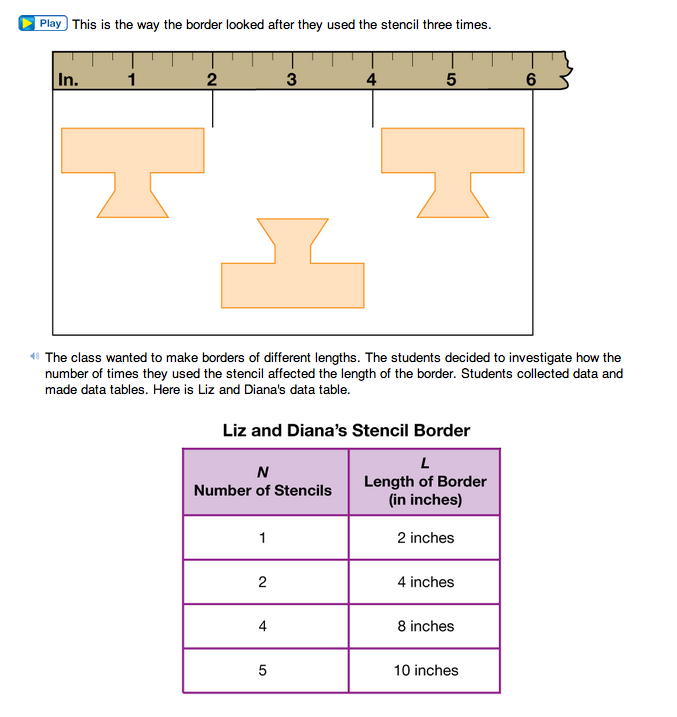
Discuss the variables in the investigation using Questions 1–4 in the Student Guide to prepare them to draw a picture of this investigation. Use Question 1 to discuss what variables the two girls compared in their data table: the Number of Stencils (N) and the Length of the Border (L). Question 2 asks what stayed the same or which variables are fixed as the girls made the border. In order to look for the relationship between the number of stencils in the border and the length of the border, the size and shape of the stencil must stay the same, there must not be any space between the stencils, and the orientation of the cards (either vertical or horizontal) must be the same each time. See Figure 3. Each time the girls colored in a stencil, they placed the index card vertically and marked the paper at the edge of the stencil.
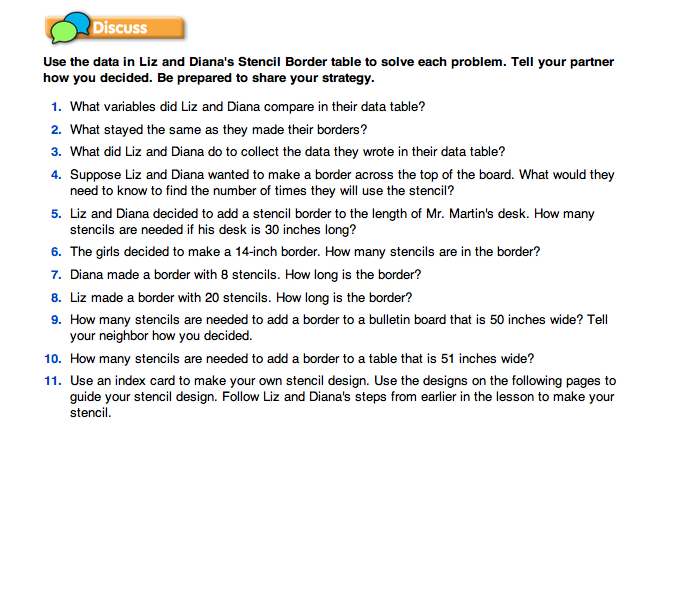
Use Question 3 to discuss the procedure the girls used to collect the needed data. They made a border with 5 stencils, then measured the distance between their marks to find the length of one, two, four, and five stencils. Ask students how they can use this data to figure out how many stencils would be in a border used to decorate the top of the board (Question 4).
Ask:
Solve Problems Using Data. Ask students to work with a partner to answer and discuss strategies for solving Questions 5–8. As students are working, identify student strategies to discuss with the entire class. Look for a variety of strategies. Some students will skip count and others will reason from the information in the data table. See Figure 4 for some examples. Give each student materials needed to prepare a display of their strategy.
Discuss Questions 5–8 by asking the identified students to display their strategy for the class. Leave these strategies displayed around the classroom for the remainder of the lesson.
Ask:
Apply Strategies. Follow up by asking students to use one of the strategies shared while discussing Questions 5–8 to solve Question 9 in the Student Guide.
Ask:
Ask a few students to share their strategy for solving Question 9 to prepare students to answer Question 10. In Question 10, students are asked to determine the number of stencils needed to make a border that is 51 inches in length. This is problematic because 51 inches is not evenly divisible by 2. Some students may decide that they need 25 stencils because 26 stencils would make a border that is 52 inches and therefore too long. Other students might argue that half of a stencil is 1 inch so a border of 251/2 stencils would make a border 51 inches long, the length of the board. Students are inevitably going to encounter similar situations when they are measuring the length of real locations in a classroom.