Getting to Know Room 204
Est. Class Sessions: 2Developing the Lesson
Part 2: Collecting the Data
Choose a Variable to Study. After students have generated a list of variables and their possible values, ask them to choose one variable to study. Students will collect data on the chosen variable, organize the data, and make a bar graph.
Some variables listed in your table might have values that are numbers, such as number of people in your family or height in inches. For this activity choose a variable, such as Main Interest or Eye Color, that does not have numerical values. Students will work with numerical variables in Lesson 2.
It is important that the variable you choose to study is well defined and that it involves quick and easy data collection. For example, if you are studying students' birth places, define what is meant by birth place. The values of the variable Birth Place could be the states in which the students were born, the countries in which they were born, or the actual place their mothers gave birth, e.g., home, hospital, or ambulance. Some students might not know this information offhand, which may complicate the data collection.
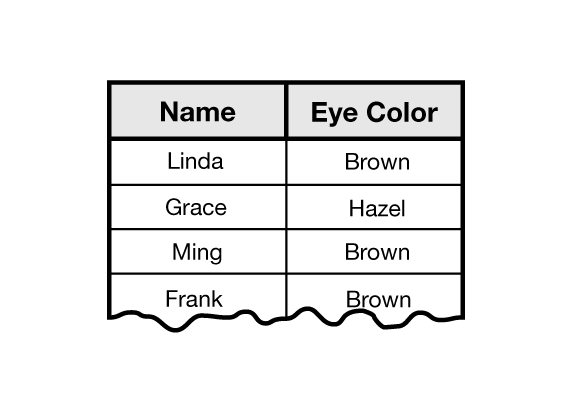
Collect the Raw Data. First collect the students' raw data, then reorganize this information as shown in Figures 2 and 3. To record the raw data, create a class data table on the board or on poster-size graph paper. In the first column, list students' names. List the variable you are studying in the heading of the second column. Each student's individual data is recorded beside his or her name. Part of Room 204's raw data table is shown in Figure 2.
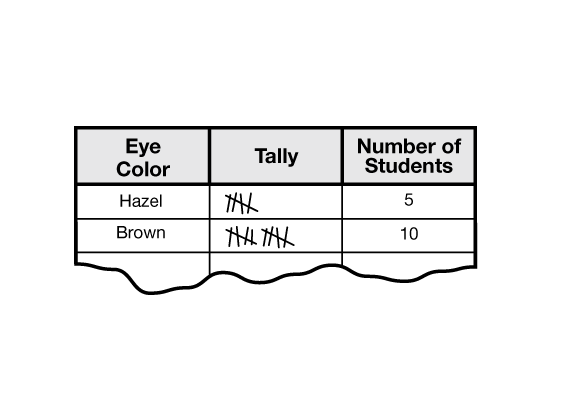
Organize the Data in a Table. Next, organize the data in a new table like that in Figure 3. Label the headings as follows: the name of the variable you are studying, “Tally,” and “Number of Students.” In the first column list all of the values that appeared in your raw data table. Each value needs to be listed only once in this table. Then, as the class reads the list of values one by one from the raw data, have a student make a tally mark beside the corresponding value in your new table. Count the total for each row and record it in the third column. The total number of all the tally marks should equal the number of students in the class. The organized data can then be graphed.


