Getting to Know Room 204
Est. Class Sessions: 2Developing the Lesson
Part 3: Graphing and Exploring the Data
Represent Data in a Graph. If your students have not had previous graphing experiences, you can make a class graph together before students make their own individual bar graphs. Two options are described below.
Option 1
Make a human bar graph. For example, if your class chooses to study eye color, have all students with brown eyes stand in a single-file line. The first student should hold a piece of paper on which “brown” has been written. Those students with green eyes form a line parallel to the first line, and so on. This way, the lines of students are the bars of the graph.
Option 2
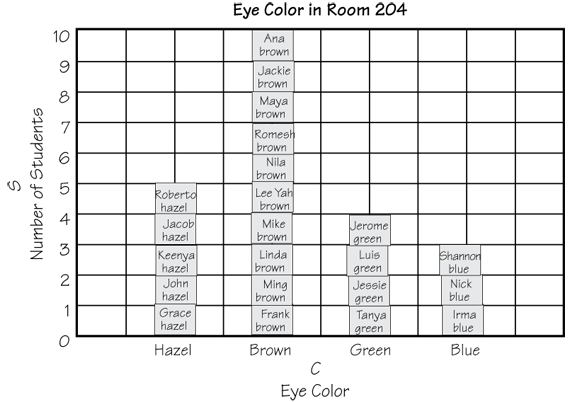
Use self-adhesive notes on a class bar graph. For example, if you are studying eye color, have each student write his or her name on a self-adhesive note along with his or her eye color. Each student brings the self-adhesive note to the front of the class and places it appropriately on the class graph. The graph can be created on poster-size graph paper or on easel paper. See Figure 4.
Each student should make his or her own graph on a copy of the Centimeter Graph Paper Master. You can use a display of Centimeter Graph Paper to demonstrate setting up a graph. Be sure to discuss the following before students create their own graphs: giving the graph a title, labeling and scaling axes, and drawing the bars.
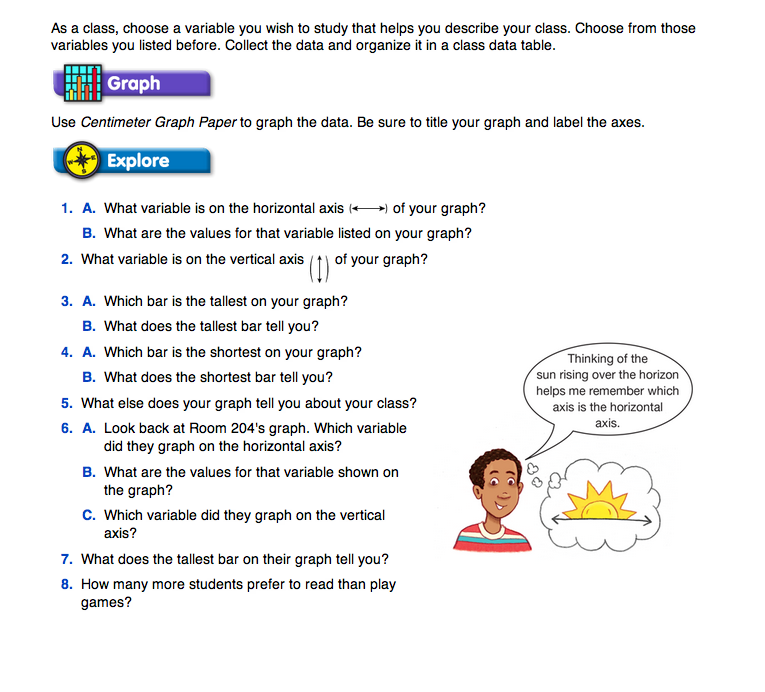
Explore the Data. After students complete their bar graphs, discuss Questions 1–8 in the Explore section in the Student Guide. To involve more students in the discussion, students may first discuss the questions in pairs or groups before sharing their answers with the entire class.
Students should use their own graphs to answer Questions 1–5. A natural discussion of the class data should arise. Questions 1–5 are just a few of the many questions that may be asked to guide such a discussion. Question 5 asks students to read the graph to find more information. Possible descriptions of the graph of the Room 204 data in Figure 4 include the following:
- The most common eye color is brown.
- Almost half of the class has brown eyes.
- About the same number of students have hazel, green, and blue eyes.
- If a new student came to our class, I might predict that he or she has brown eyes.
Questions 6–8 ask similar questions about the graph for Room 204's Main Interests.
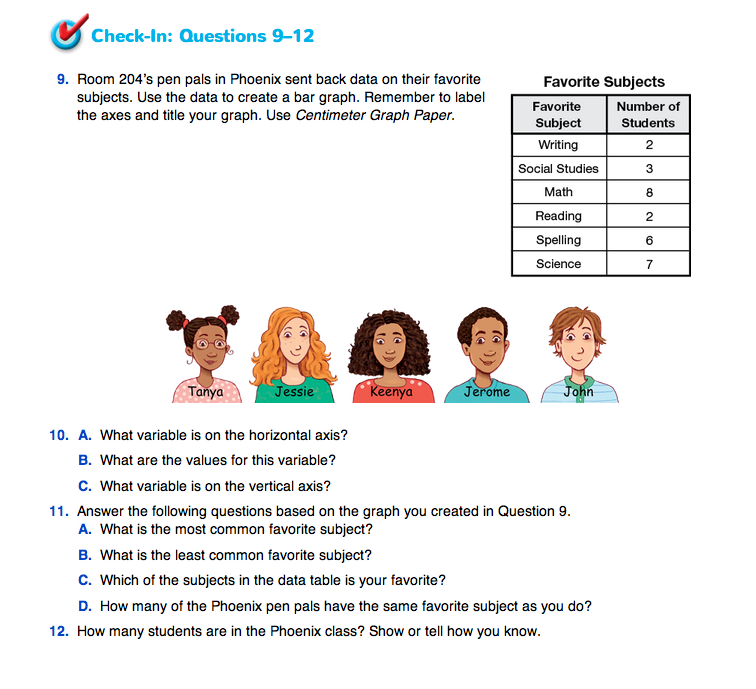
Have students work individually to answer Check-In: Questions 9–12. Each student will need a copy of the Centimeter Graph Paper Master.


