Arm Span vs. Height
Est. Class Sessions: 4–5Developing the Lesson
Part 3. Drawing and Collecting
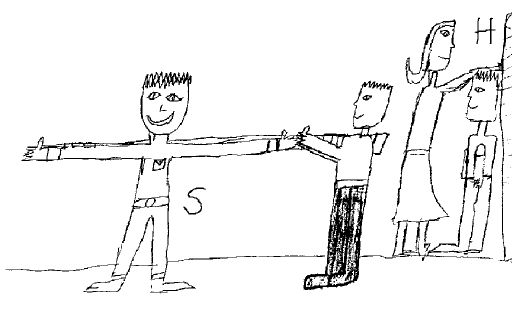
Draw the Picture. Students will draw a picture of the investigation. Before they begin, discuss what goes in the picture: the main variables of the experiment and the procedure. Figure 3 is a sample picture which clearly shows the two main numerical variables, arm span and height.
Use Irma's picture of her experiment in the Student Guide to illustrate what should be in the picture. Discuss with students some additional pieces that can be added to their pictures. For example, the sample picture in the Student Guide does not show how the metersticks are aligned for measuring height. Discuss any additional steps or variables that illustrate the measurement procedure. Then, ask students to begin drawing their pictures. While some groups draw their pictures, others may collect and record their data or complete the Plotting Points Pictures in the Student Activity Book.
The two main variables, arm span and height, are both numerical variables (Question 1). Question 2 asks what is the same about all the people students measured in the experiment. If students measured their classmates, they should realize that their ages are about the same. All the measurements in this lab are of fourth-graders—generally speaking, nine- or ten-year-olds. Age, therefore, is another fixed variable.
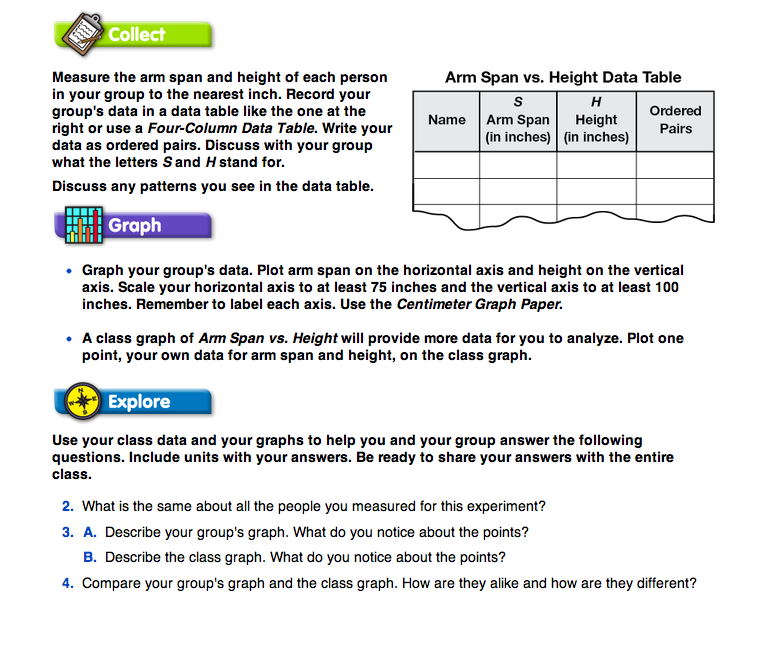
Collect Data. Students should work in groups to collect and organize their data using a Four-Column Data Table Master. They use the last column of the table to record the data as ordered pairs.
After the groups have collected their data, reconvene as a class and ask one student from each group to transfer the group's data onto the display of the class data table. Discuss any patterns students see.
Ask:


