Getting to Know Room 204 a Little Better
Est. Class Sessions: 2Developing the Lesson
Part 1: Describe Room 204 with Numerical Variables
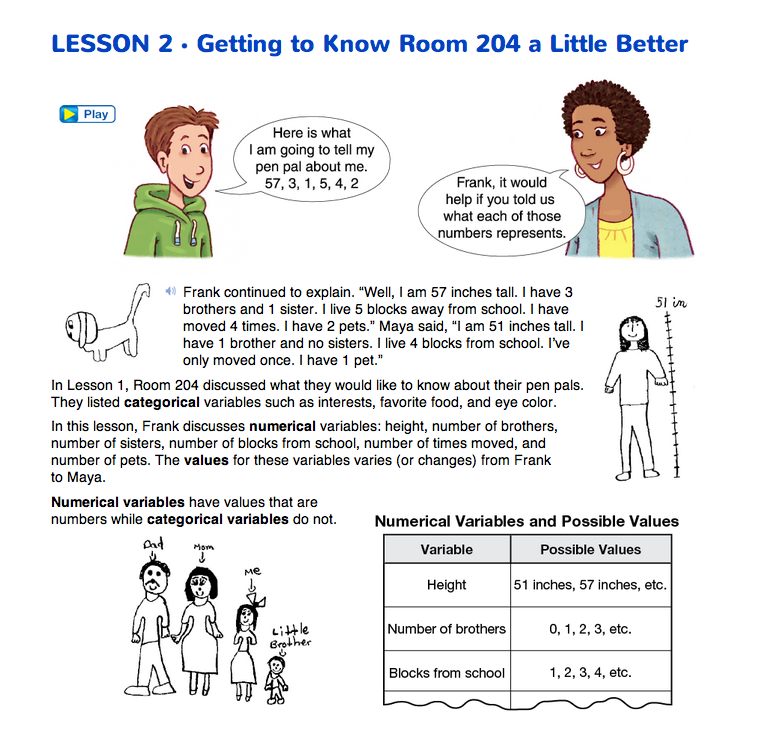
Compare Categorical and Numerical Variables. Read together the first page of the Getting to Know Room 204 a Little Better pages in the Student Guide. Compare the types of variables discussed in Lesson 1 (e.g., main interest, favorite holiday, eye color, hair color) to those mentioned here (e.g., height, number of brothers, number of sisters, number of pets, number of times moved). Those discussed in Lesson 1 are categorical variables. In this lesson we focus on numerical variables. Numerical variables have values that are numbers while categorical variables do not.
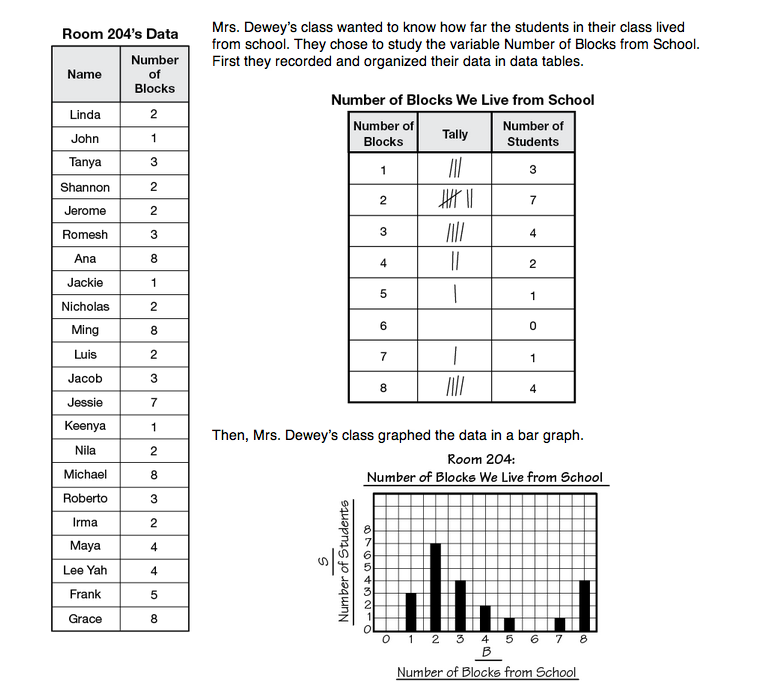
Read together the second page of the Getting to Know Room 204 a Little Better pages in the Student Guide. Discuss the order in which the data tables were recorded.
Ask:
Find the Mode. Explain to students that the value that appears most frequently in a data set is called the mode. Sometimes that number is used to represent the whole data set. It is a kind of average.
Ask:
Students will learn about another kind of average, the median, in Lesson 3.
Choose a Variable to Study. Refer back to the Variables and Possible Values Data Table students generated in Lesson 1. See Figure 1 in Lesson 1. Some variables your class listed in Lesson 1 may be numerical variables. Title the third column, “Type of Variable” (categorical or numerical). Ask students to say whether each variable is categorical or numerical and add their responses to the third column of the data table. For example, height and hand length are numerical variables. Eye color and birthday month are categorical. Brainstorm a few more variables with the class to ensure they understand the difference between categorical and numerical variables.
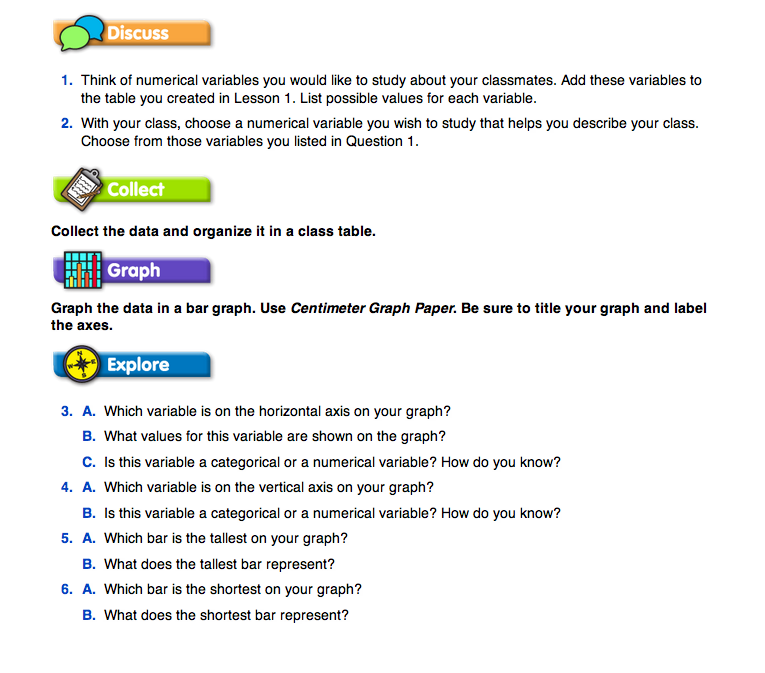
Students work in groups to generate more numerical variables for the table (Question 1). Have each group draw a two-column data table. Ask them to record numerical variables in the first column and values that correspond to each variable in the second column. Some common examples of numerical variables are number of family members, number of pets, height, and number of times moved. The values of these variables are numbers, e.g., the number of pets could be 0, 1, 2, 3, etc. After students have been given ample time to think of different numerical variables, pull the class together and add some of their ideas to the Variables and Possible Values Data Table from Lesson 1. See Figure 1 in Lesson 1.
Question 2 asks your class to choose a numerical variable to study. It is important that the variable you choose involves quick and easy data collection and is well defined. See the TIMS Tip.


