Students collect data to model the relationship between the arm span and height of their classmates. They then use these models to make predictions and generalizations.
Content in this Lesson
- Making a bar graph using categorical data [E3].
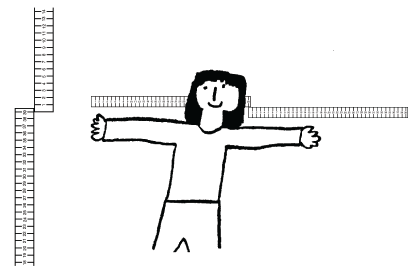
- Representing the variables and the procedures of an investigation in a drawing.
- Measuring length in inches.
- Finding the median of a data set represented in a point graph [E6].
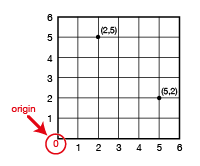
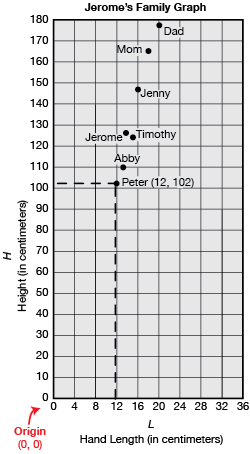
- Making a point graph using ordered pairs [E5].
- Reading a table or graph to find information about a data set [E7].
- Translating between bar and point graphs and real-world situations [E8].
- Making predictions and generalizations about a data set using a median [E9].
- Making predictions and generalizations about a data set using a data table and graph [E10].
- Identifying the important information and the question in a problem [MPE1].
- Showing a problem's solution [MPE5].
- Demonstrating fluency with addition facts [E11].
Assessment in this Lesson
| Assessment | Expectation Assessed | Math Practice Assessed |
|---|---|---|
|
Arm Span vs. Height Student Guide Pages 34–41 with corresponding Feedback Box Teacher Guide - digital |
|
|
|
Arm Span vs. Height Peer Review of Question 6 Student Guide Page 40 |
|
|
|
More Arm Span vs. Height Data with Feedback Box Teacher Guide - digital |
|
|
|
DPP Item O Addition Test: Doubles, 2s, 3s Teacher Guide - digital |
|
|
|
DPP Item Q Addition Test: More Addition Facts Teacher Guide - digital |
|
|
|
DPP Item T Favorite Sandwiches Teacher Guide - digital |
|


