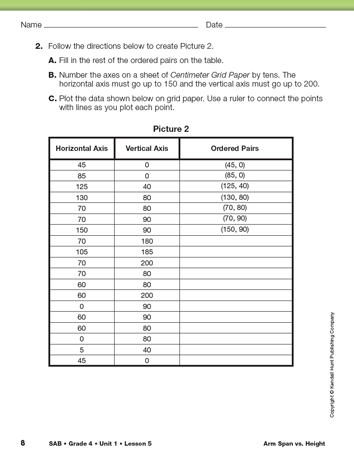
Arm Span vs. Height
Est. Class Sessions: 4–5Developing the Lesson
Part 1. Showing Data Using Ordered Pairs
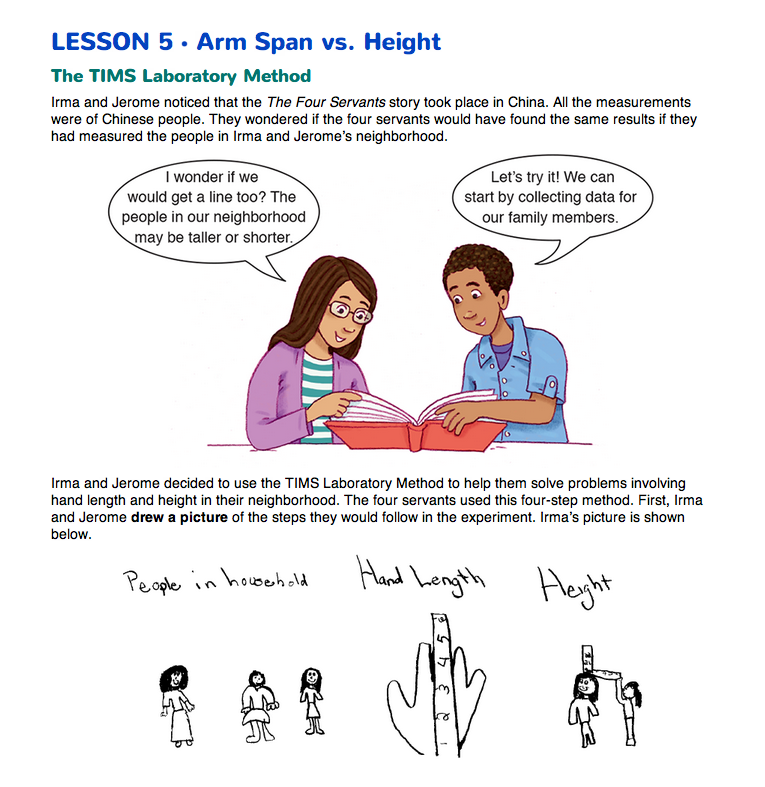
The Arm Span vs. Height pages in the Student Guide outline the four steps of the TIMS Laboratory Method. These steps were reviewed in the The Four Servants story in Lesson 4.
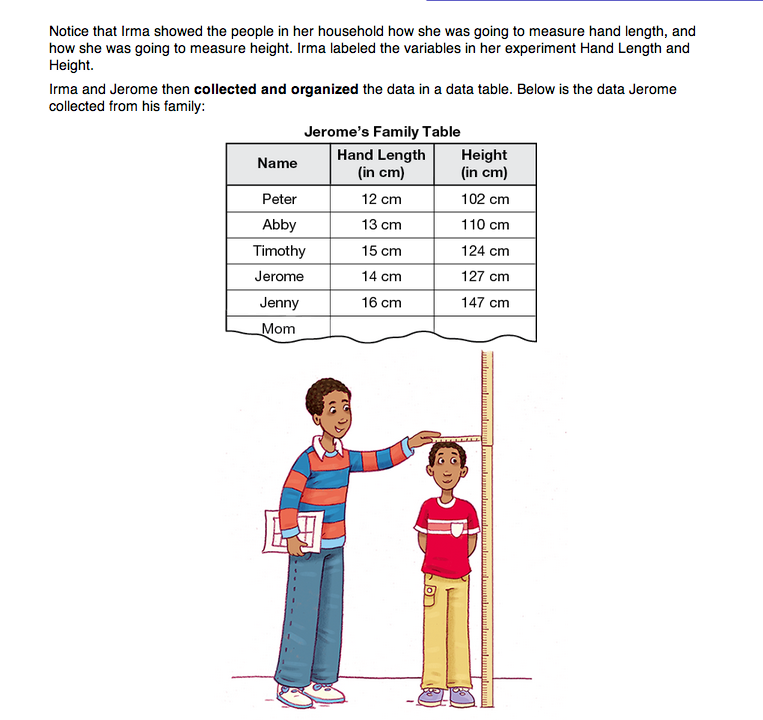
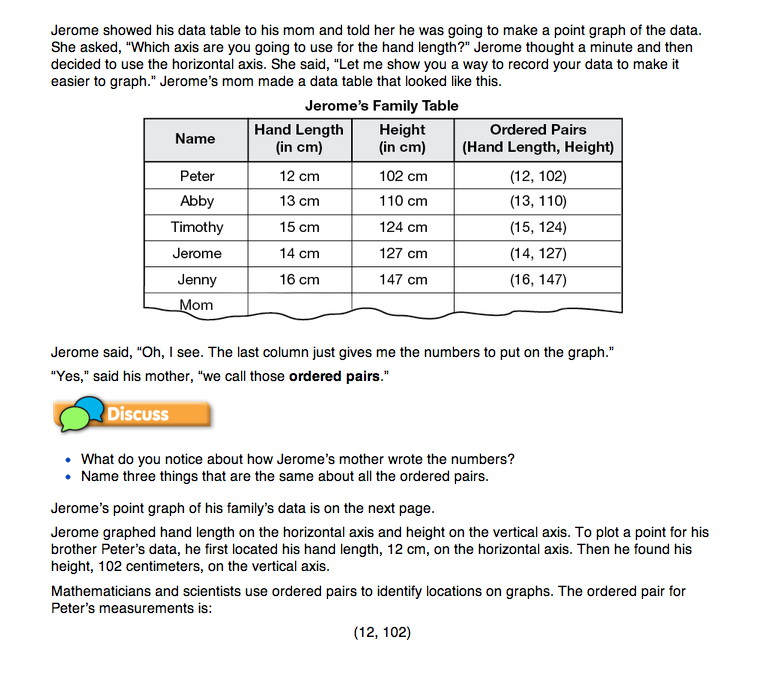
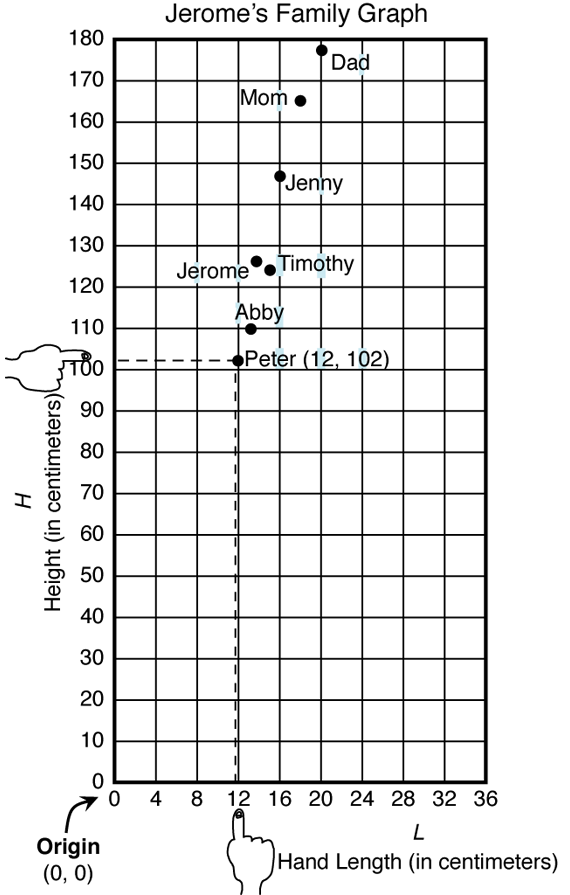
In the Student Guide pages Irma and Jerome use the TIMS four-step method to solve a problem. Jerome collected data from his family on their hand lengths and heights and graphed the data as a point graph. Direct students' attention to a display of Jerome's Family: Hand Lengths and Heights Master in the Teacher Guide to show how points are plotted and to introduce students to ordered pairs.
In the vignette, Jerome's mother wrote Jerome's data as ordered pairs, always writing the hand length value first. This is because the variable hand length is graphed on the horizontal axis in Jerome's graph. Jerome is graphing height on the vertical axis, so that value comes second in the ordered pair.
The bulleted questions in the Discuss section ask:
Redirect students' attention to Jerome's Family: Hand Lengths and Heights. Tell students that a common way to plot a data point is to locate the horizontal measurement first and to locate the vertical measurement second. To check the location of each of Jerome's points, one student can locate the first number in the ordered pair, hand length, on the horizontal axis and another student can locate the second number, height on the vertical axis. As the first student begins tracing his finger straight up the graph, the other traces his finger to the right. Where the two fingers meet, the point is plotted. See Figure 2.
Notice that Jerome measured hand length and height in centimeters. Encourage students to identify some of the points on the graph. Students should see that some of the hand lengths and heights do not fall on the intersection of the graph's lines.
Ask:


