An Average Activity
Est. Class Sessions: 2Developing the Lesson
Part 1: Exploring Medians Using Data About Us
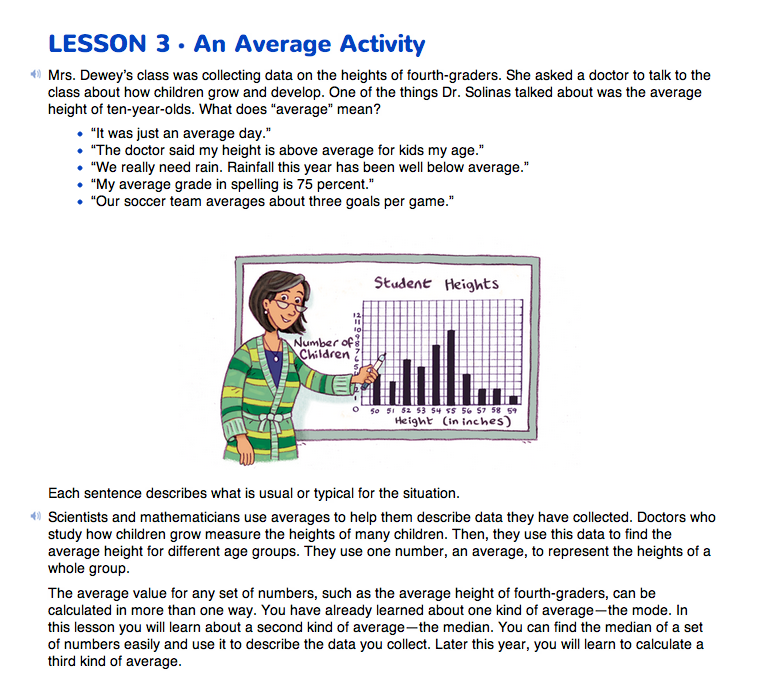
Describe Averages. Begin by exploring medians using data about the students in your class as described below. Then use the discussion about Room 204 on the An Average Activity pages in the Student Guide to review terms and formalize procedures. Begin the lesson by discussing students' current understanding of the term average.
Ask:
Generate a list of responses, which may include batting average, average rainfall, grade point average, average student, and average height. These averages indicate what is representative or typical in a given situation. Advise students that they will learn how to use one number to describe what is typical in a set of numbers.
Knowing what is typical helps us to predict what will happen with new data. For example, when a student says that she averages about two goals per game in soccer, she does not mean that she scores two goals every game. She means that the typical number of goals she scores is two, but that sometimes she scores fewer and sometimes more. Someone may reasonably predict that in the next game the student might score about two goals.
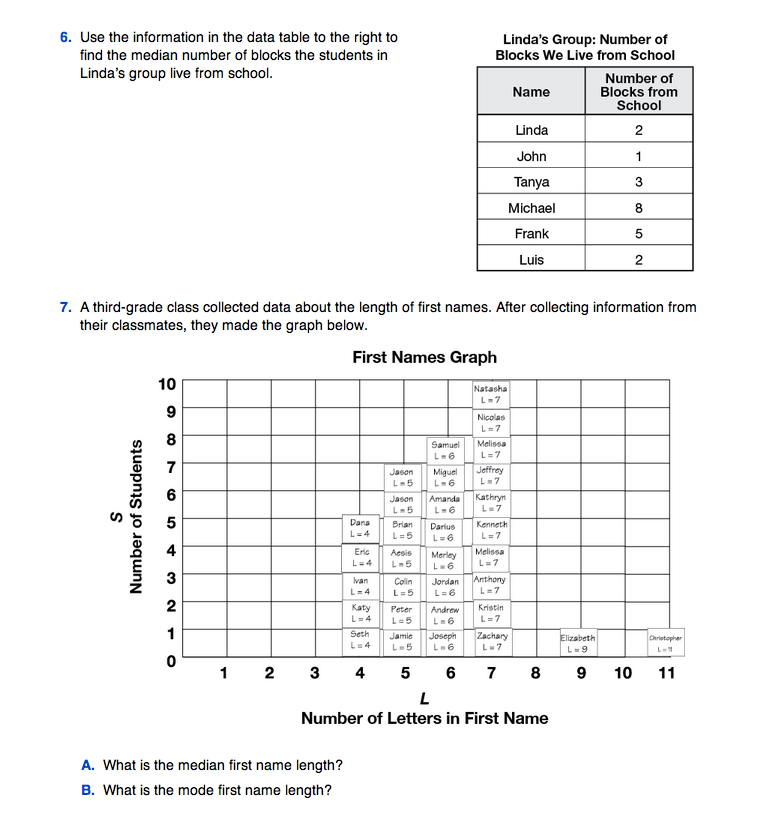
Remind students of the term mode that was defined in Lesson 2. The mode is one kind of average and is sometimes used as the typical number. Review the definition of the mode as the number that appears most frequently in a data set.
Tell students that in this activity, they will learn about another kind of average, the median. They will find the median of a data set for several variables. Define the median as the value exactly in the middle of the data.
Find Medians of Data Sets. Review the data your class collected and graphed in Lesson 2 along with the list of numerical variables your class generated at the beginning of that lesson. Choose two or three numerical variables and tell students that they are going to find the median and use it as a typical value for each variable. Choose numerical variables with values that students can easily report and that have a relatively wide range of values. Height is a good variable for this activity, since it is easy to recognize the median height of a group of students when they are standing in a line in order from shortest to tallest. In this discussion we will use the following variables as examples: height, number of pets, and number of pencils in your desk.
Ask students to write as large as possible the number of pets they have on one side of a sheet of paper and the number of pencils in their desks on the other side. (Make sure students label the numbers so they know which is which.) Define the variables precisely. For example, based on the decision of your class, the number of pencils in a desk may not include pens or markers.
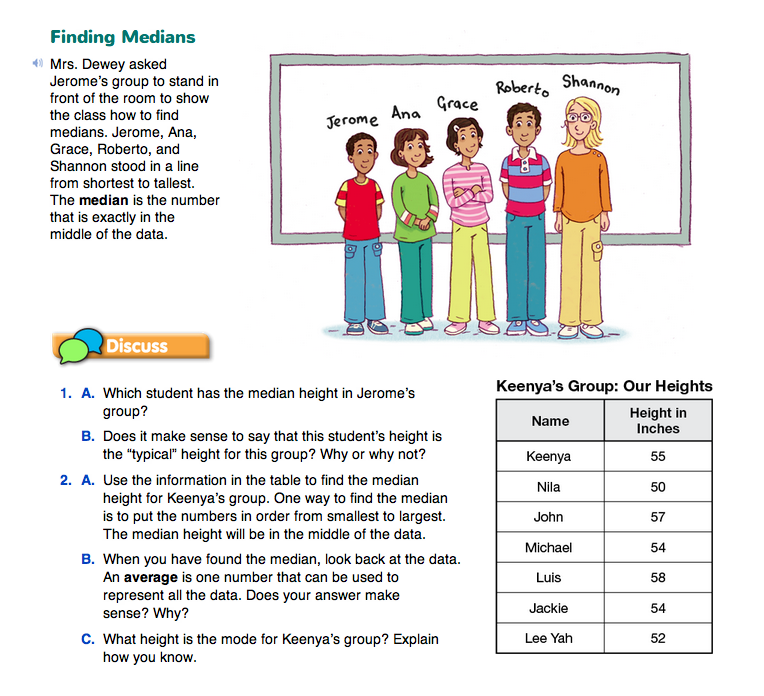
Ultimately, you will find medians for the whole class, but first demonstrate the procedure using five students lined up in front of the room. Choose five students with varying heights and ask them to arrange themselves in order from shortest to tallest. The third student in line—the student in the middle—is the student with the median height. Note that this is one example where we have to measure only the middle data point.
Next, find the median value for the other variable, number of pencils. Have the five students show the number of pencils in their desk by holding up the data they wrote on sheets of paper. The students rearrange themselves in order with the student with the smallest number of pencils at one end of the line and the student with the largest number of pencils at the other end of the line. The student in the middle of the line is holding the median number of pencils. Note that more than one student may have the median number of pencils. If the students in the line have 1, 1, 1, 2, and 2 pencils, the median is 1 pencil. (The mode is also 1 pencil.) Repeat the procedure to find the median number of pets at home.
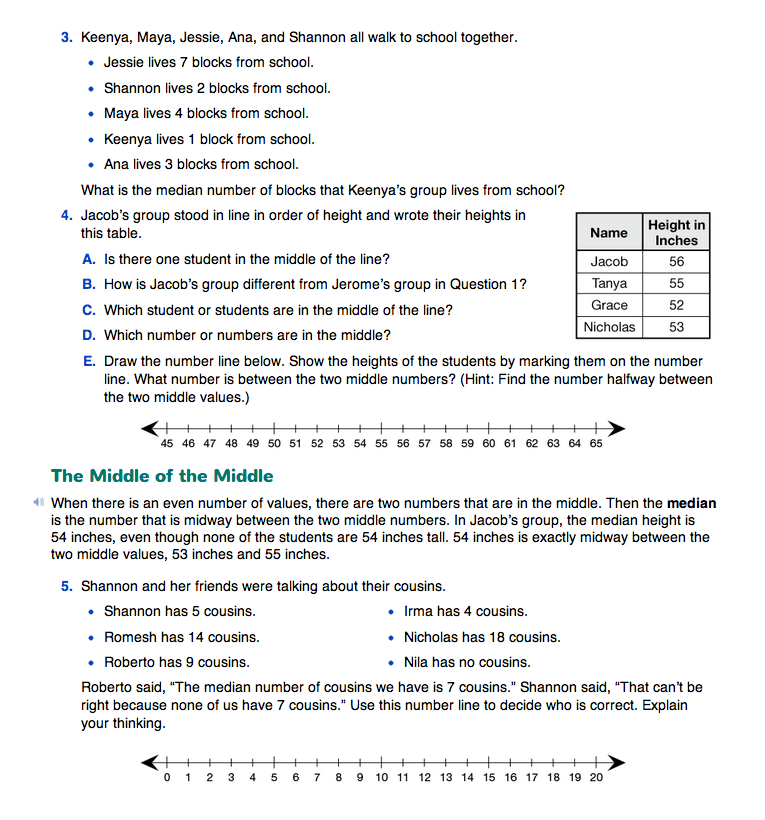
Median of an Even Number of Values. Demonstrate how to find the median of an even number of values. Ask six students to show their data for one variable, such as the number of pencils in their desks. Here are three possible data sets and the corresponding medians.
Data Set A: 0,1,3,5,6,10
Data Set B: 0,1,2,2,5,6
Data Set C: 0, 1, 3, 4, 6, 10
Medians of Larger Sets of Data. Once the students understand the process, ask the entire class to stand with their data. First, students find the median height of the entire class by comparing heights with one another, arranging themselves in order from smallest to largest, and identifying the student or students with the median height. Then, students find the medians for the other two variables in a similar fashion using the numbers they have written down.
Demonstrate or have a student demonstrate the process of counting off equal numbers from the two ends until the middle is reached.


