Introduce the Story. Ask students to prepare to share the data they collected about their family in Lesson 3 An Average Activity Homework Question 3. Have students work in pairs to compare the data they collected and their medians.
- Are the medians the same?
- Why do you think they are different?
- Why do you think they are alike?
- Looking at the hand length data in your table, do you think you can tell who is the tallest? Shortest?
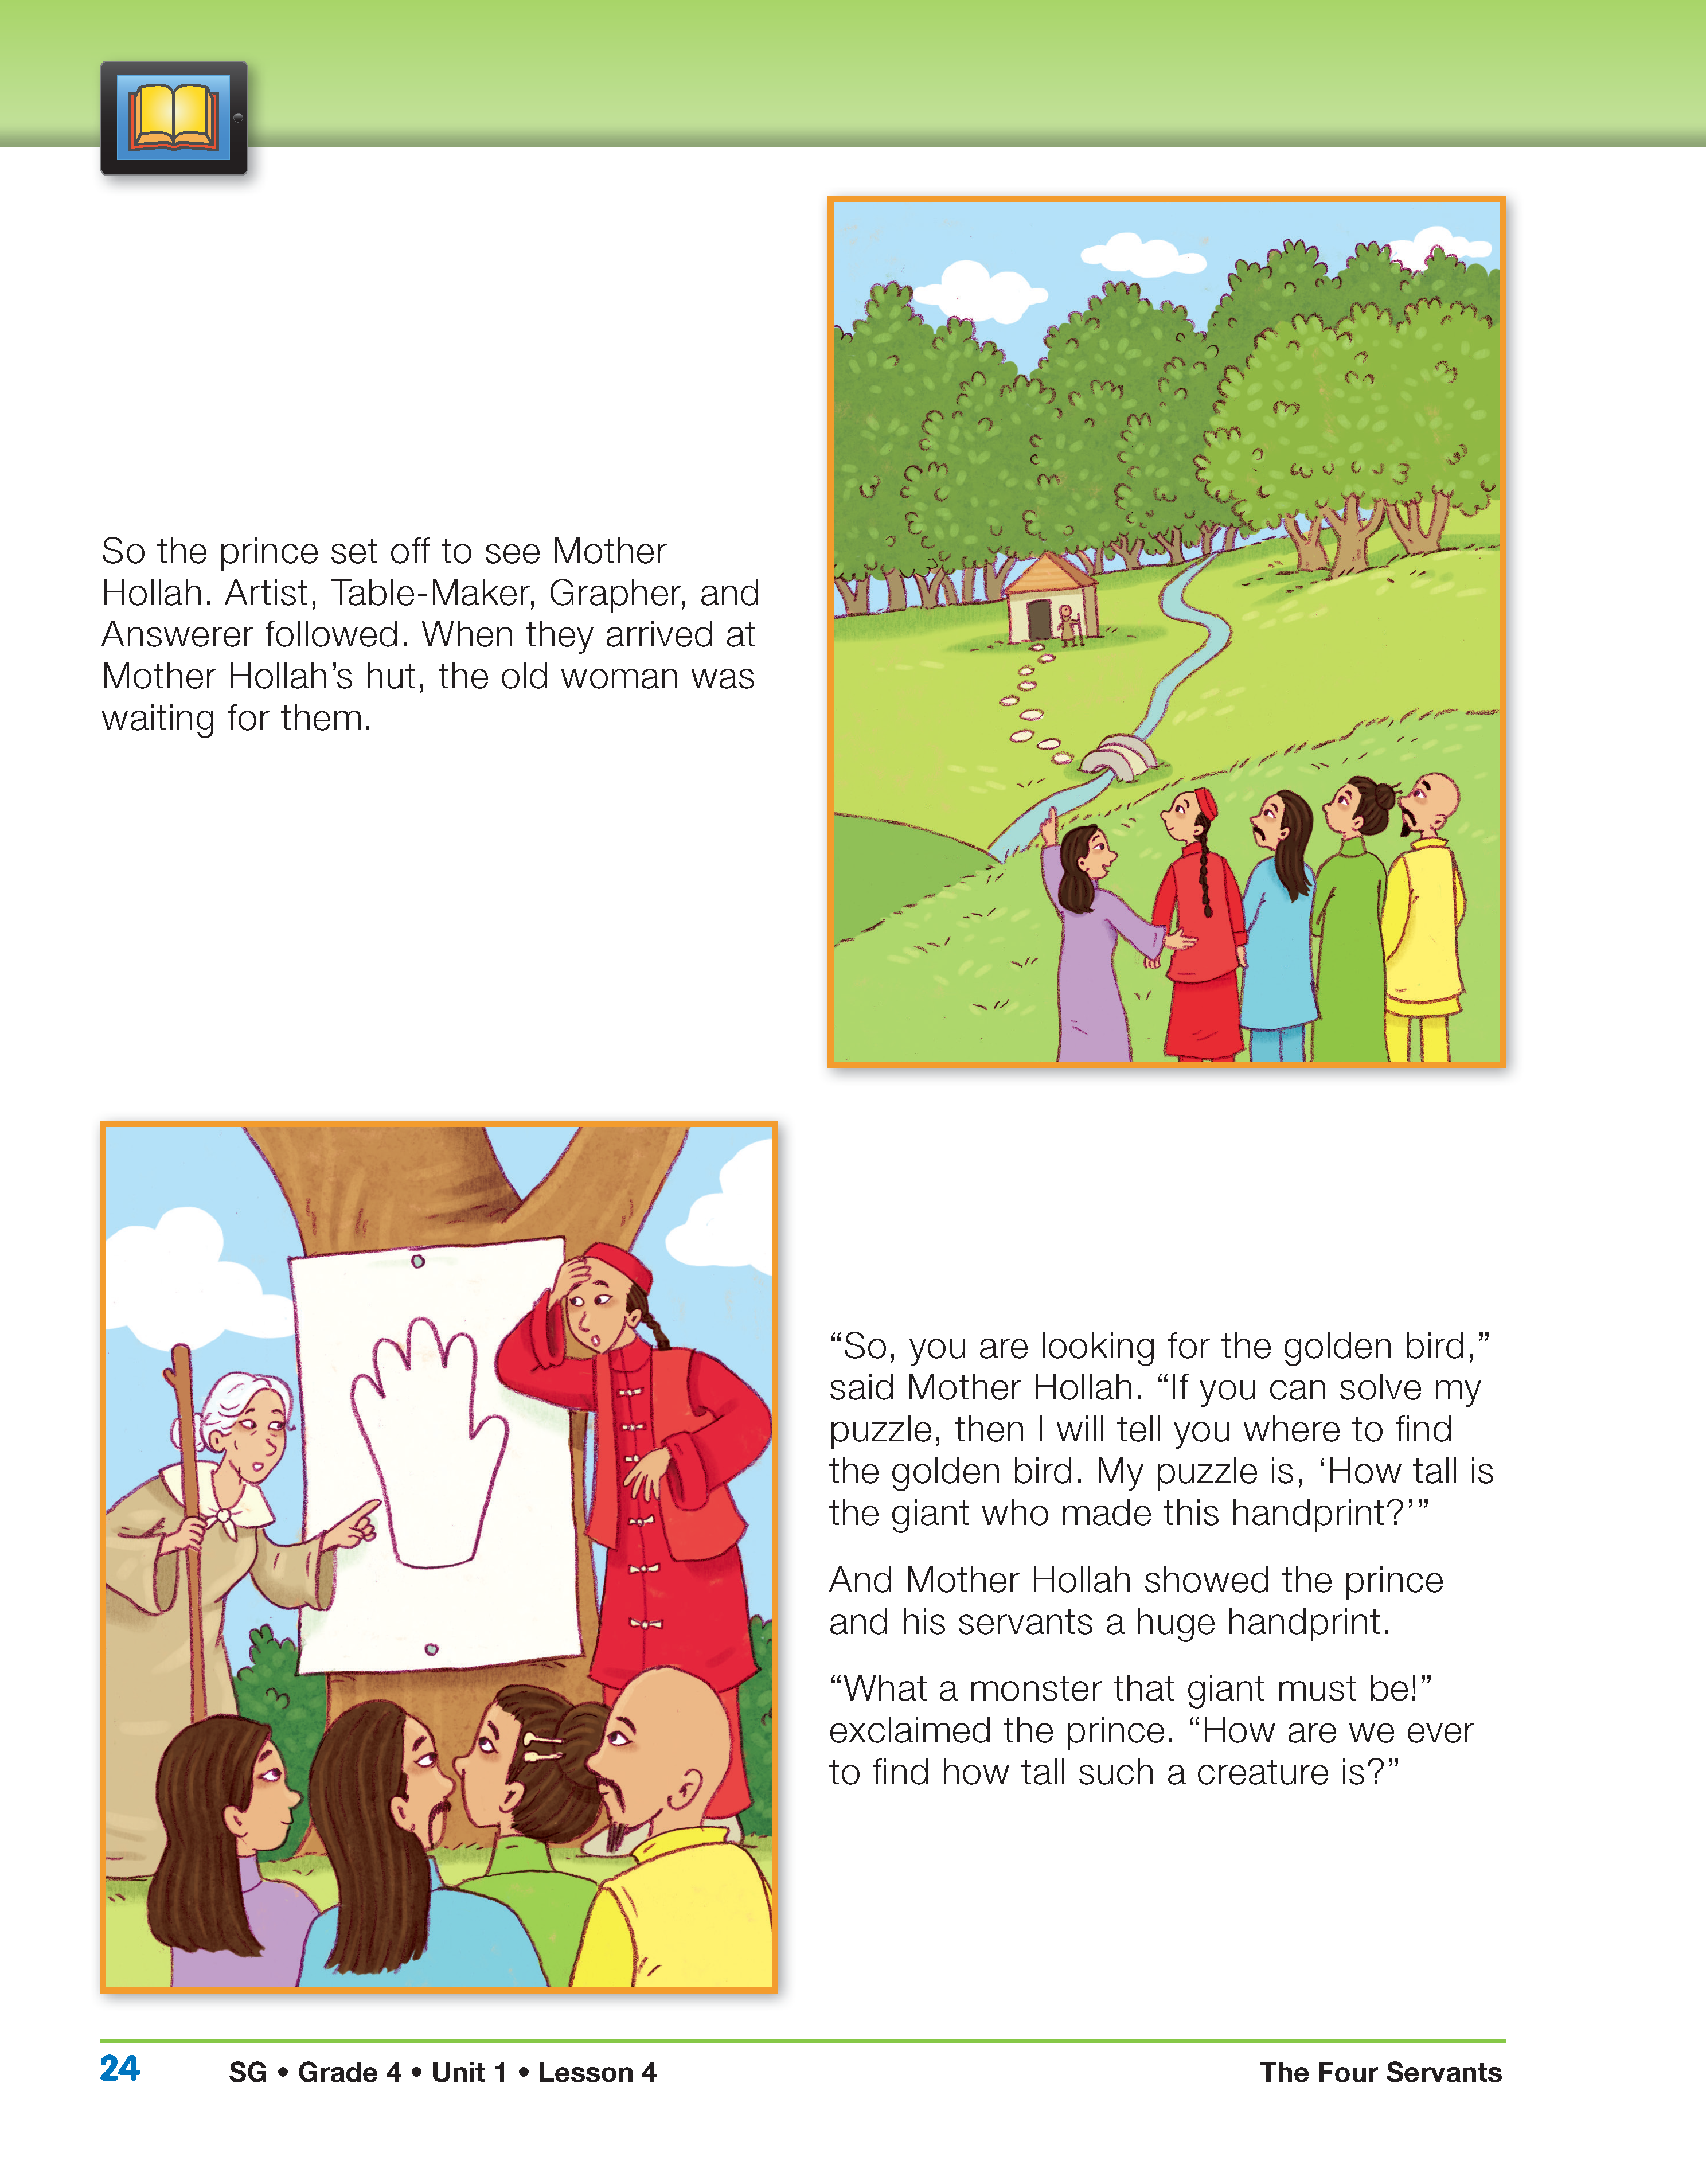
Tell students that today the class is going to read a story about a prince and his servants who look for patterns in size of a hand and height. Read and discuss The Four Servants story in the Student Guide using the discussion prompts.
Page 21
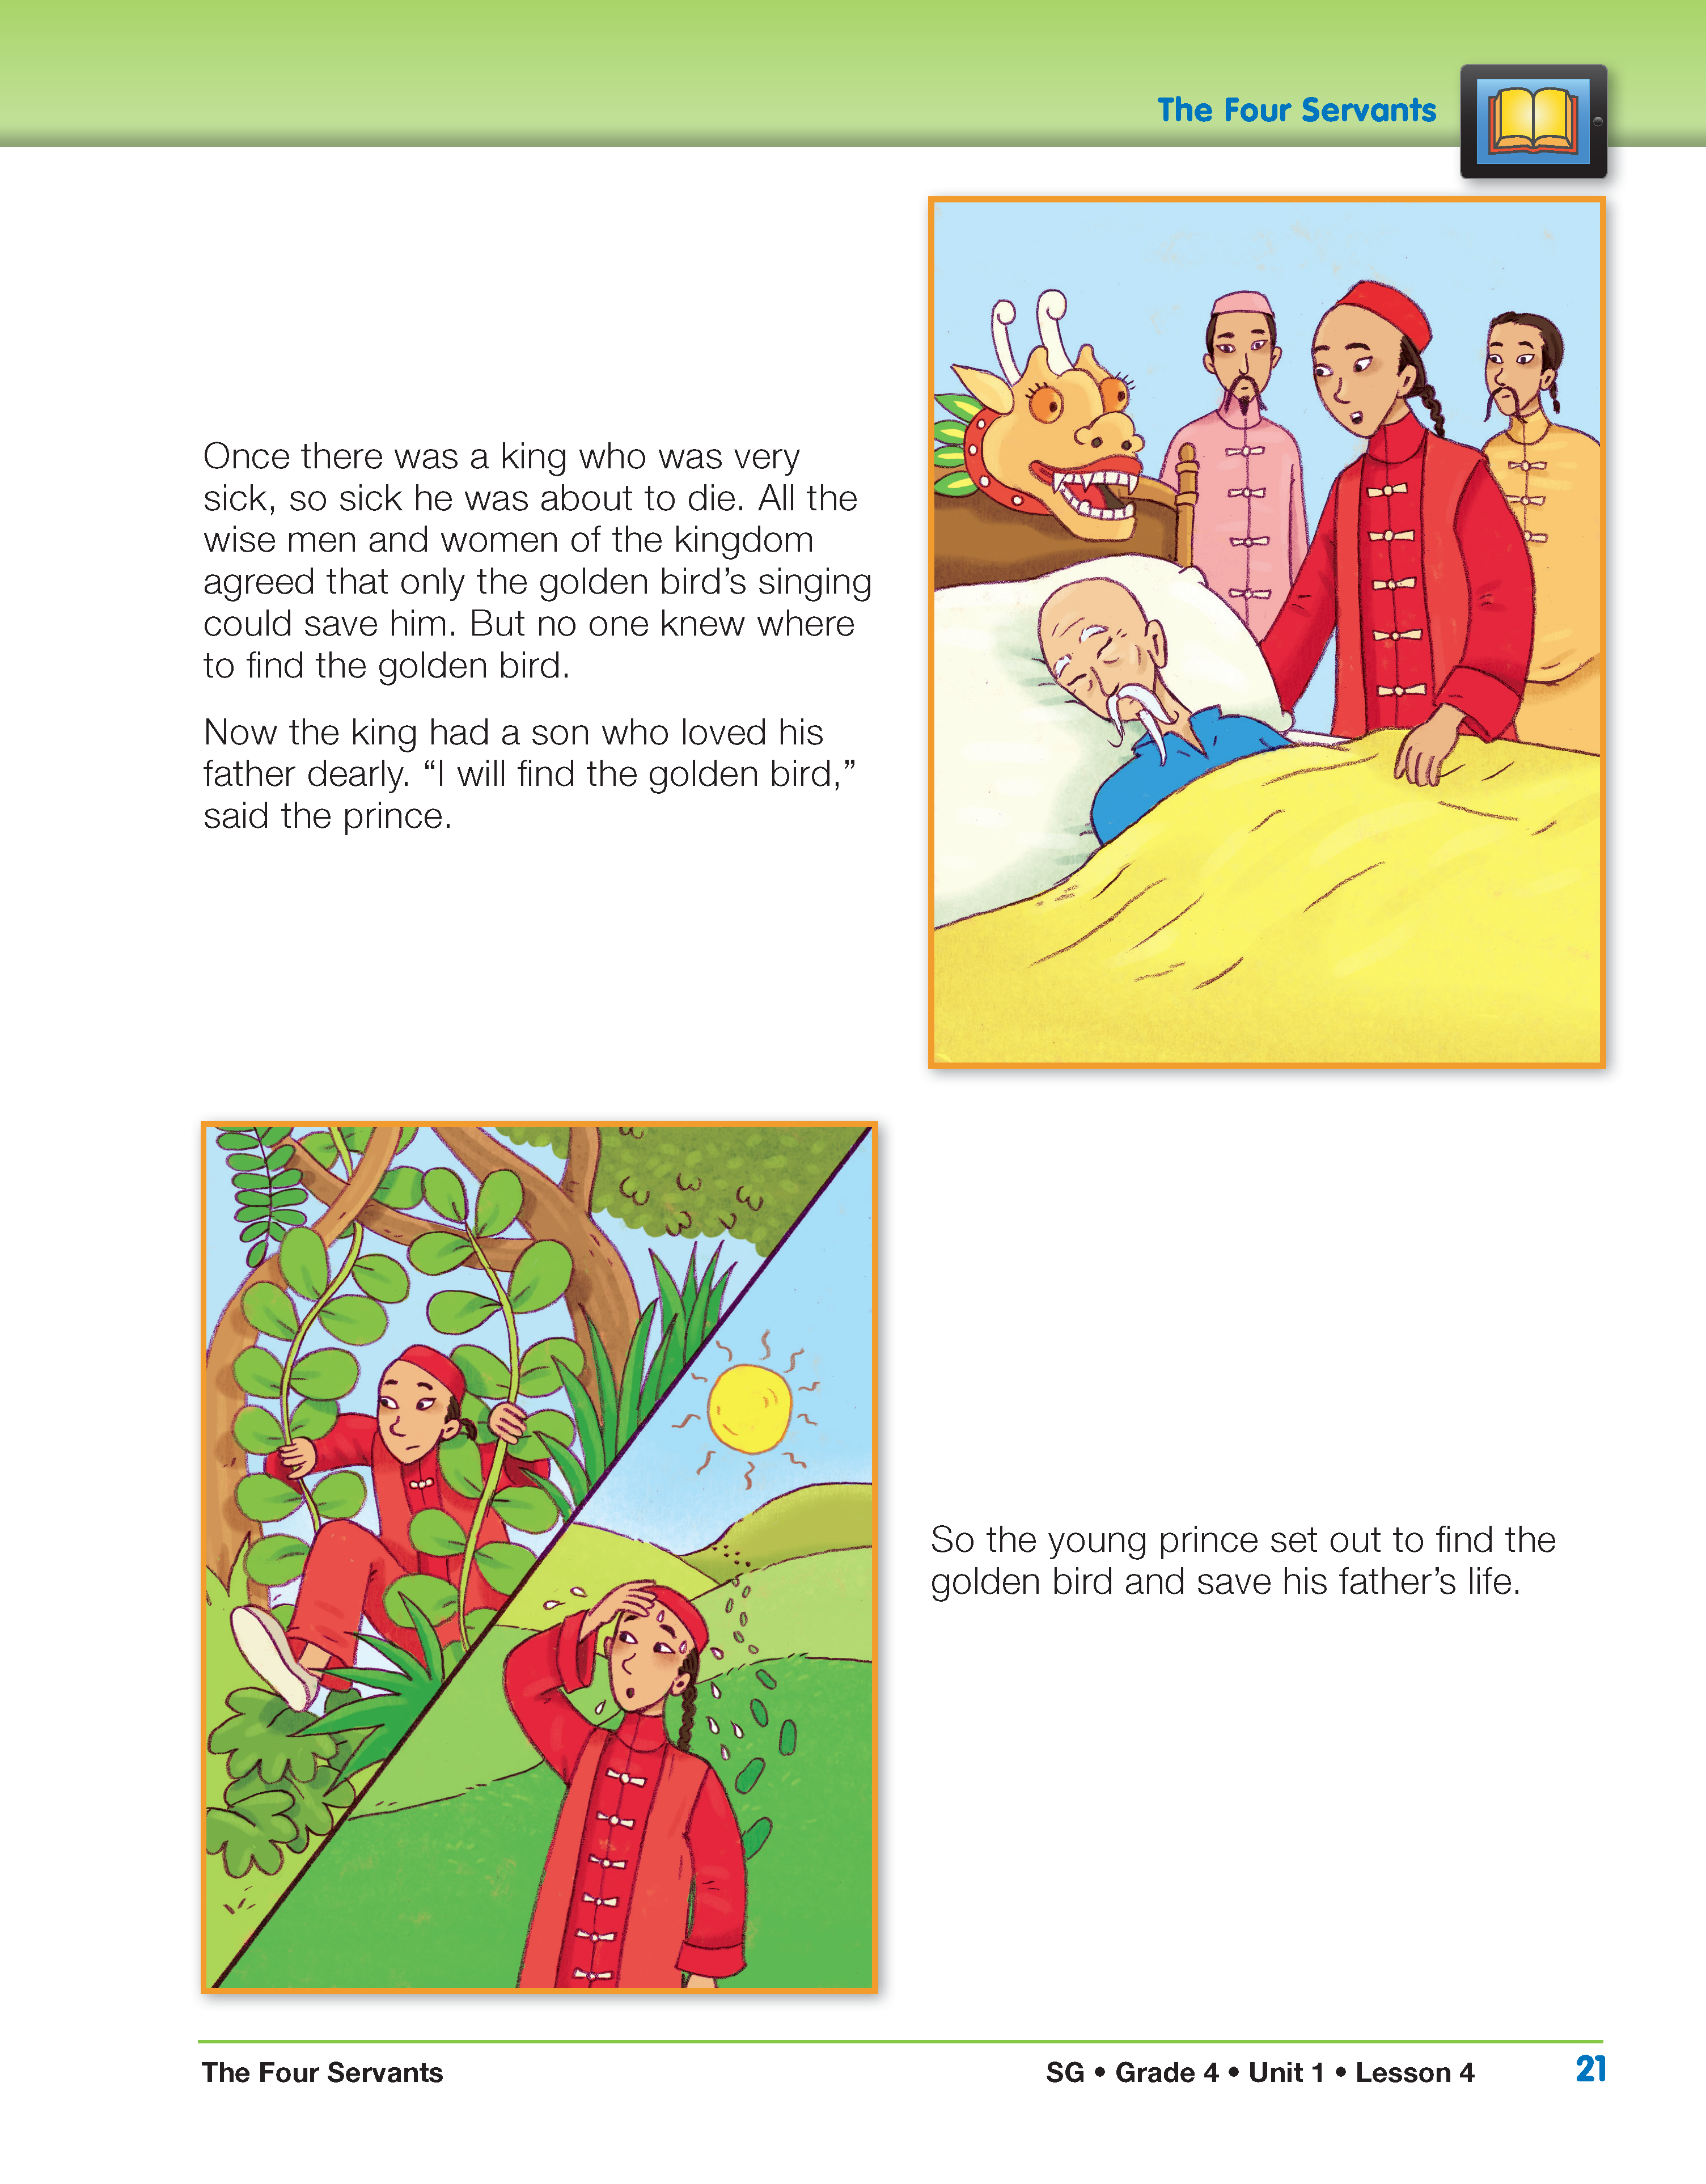
The theme of going on a quest for a magical object is common in folk literature. The search for the Holy Grail is a well-known quest tale, but more such stories abound in collections like those from the Brothers Grimm and Andrew Lang.
Page 22
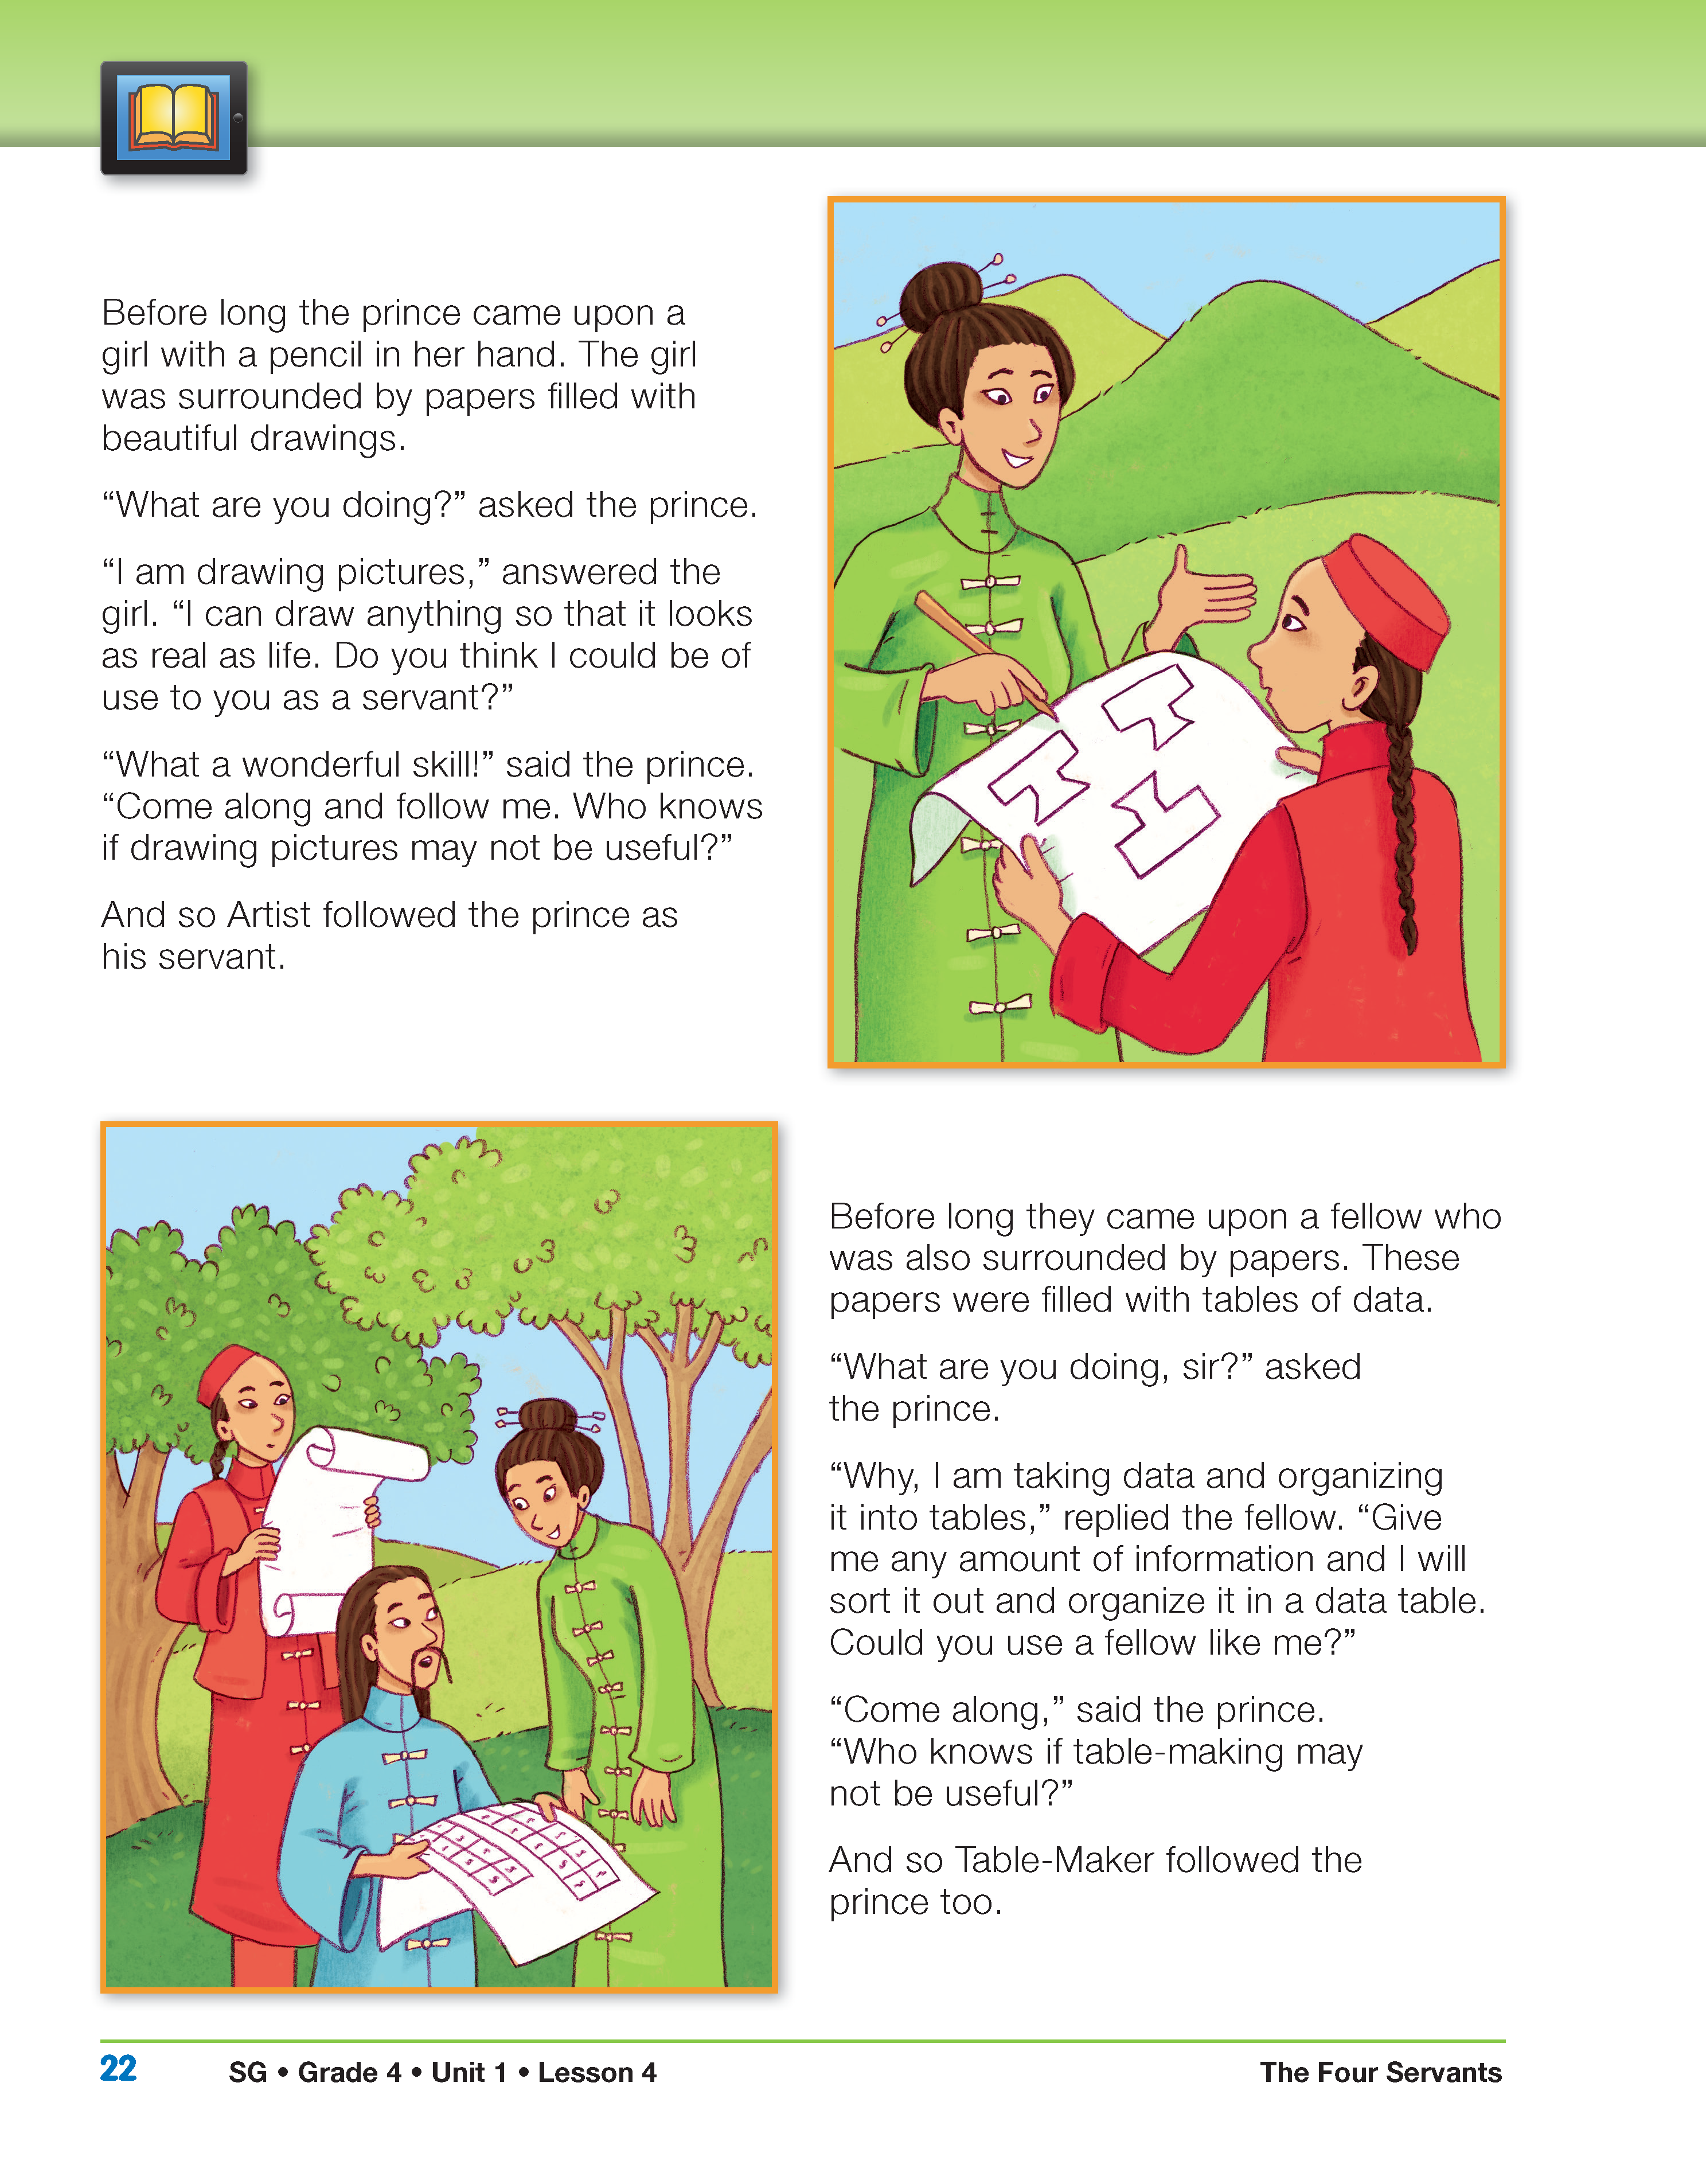
- Does the picture that Artist is making look familiar?
Artist is drawing a picture that may remind your students of the Stencilrama lesson they did in Grade 3. In that lesson, students study the relationship between the number of times an index card stencil is used and the length of the resulting pattern.
- What is Table-Maker doing? (Table-Maker is organizing data in a table.)
- Why? (We don't know why; the story doesn't say.)
- If you were writing the story, what variable would you say Table-Maker is studying? (Responses will vary. Some students may suggest categorical variables such as “Favorite Bird.” Others may suggest numerical variables such as “Number of Sons in Family.”)
Page 23
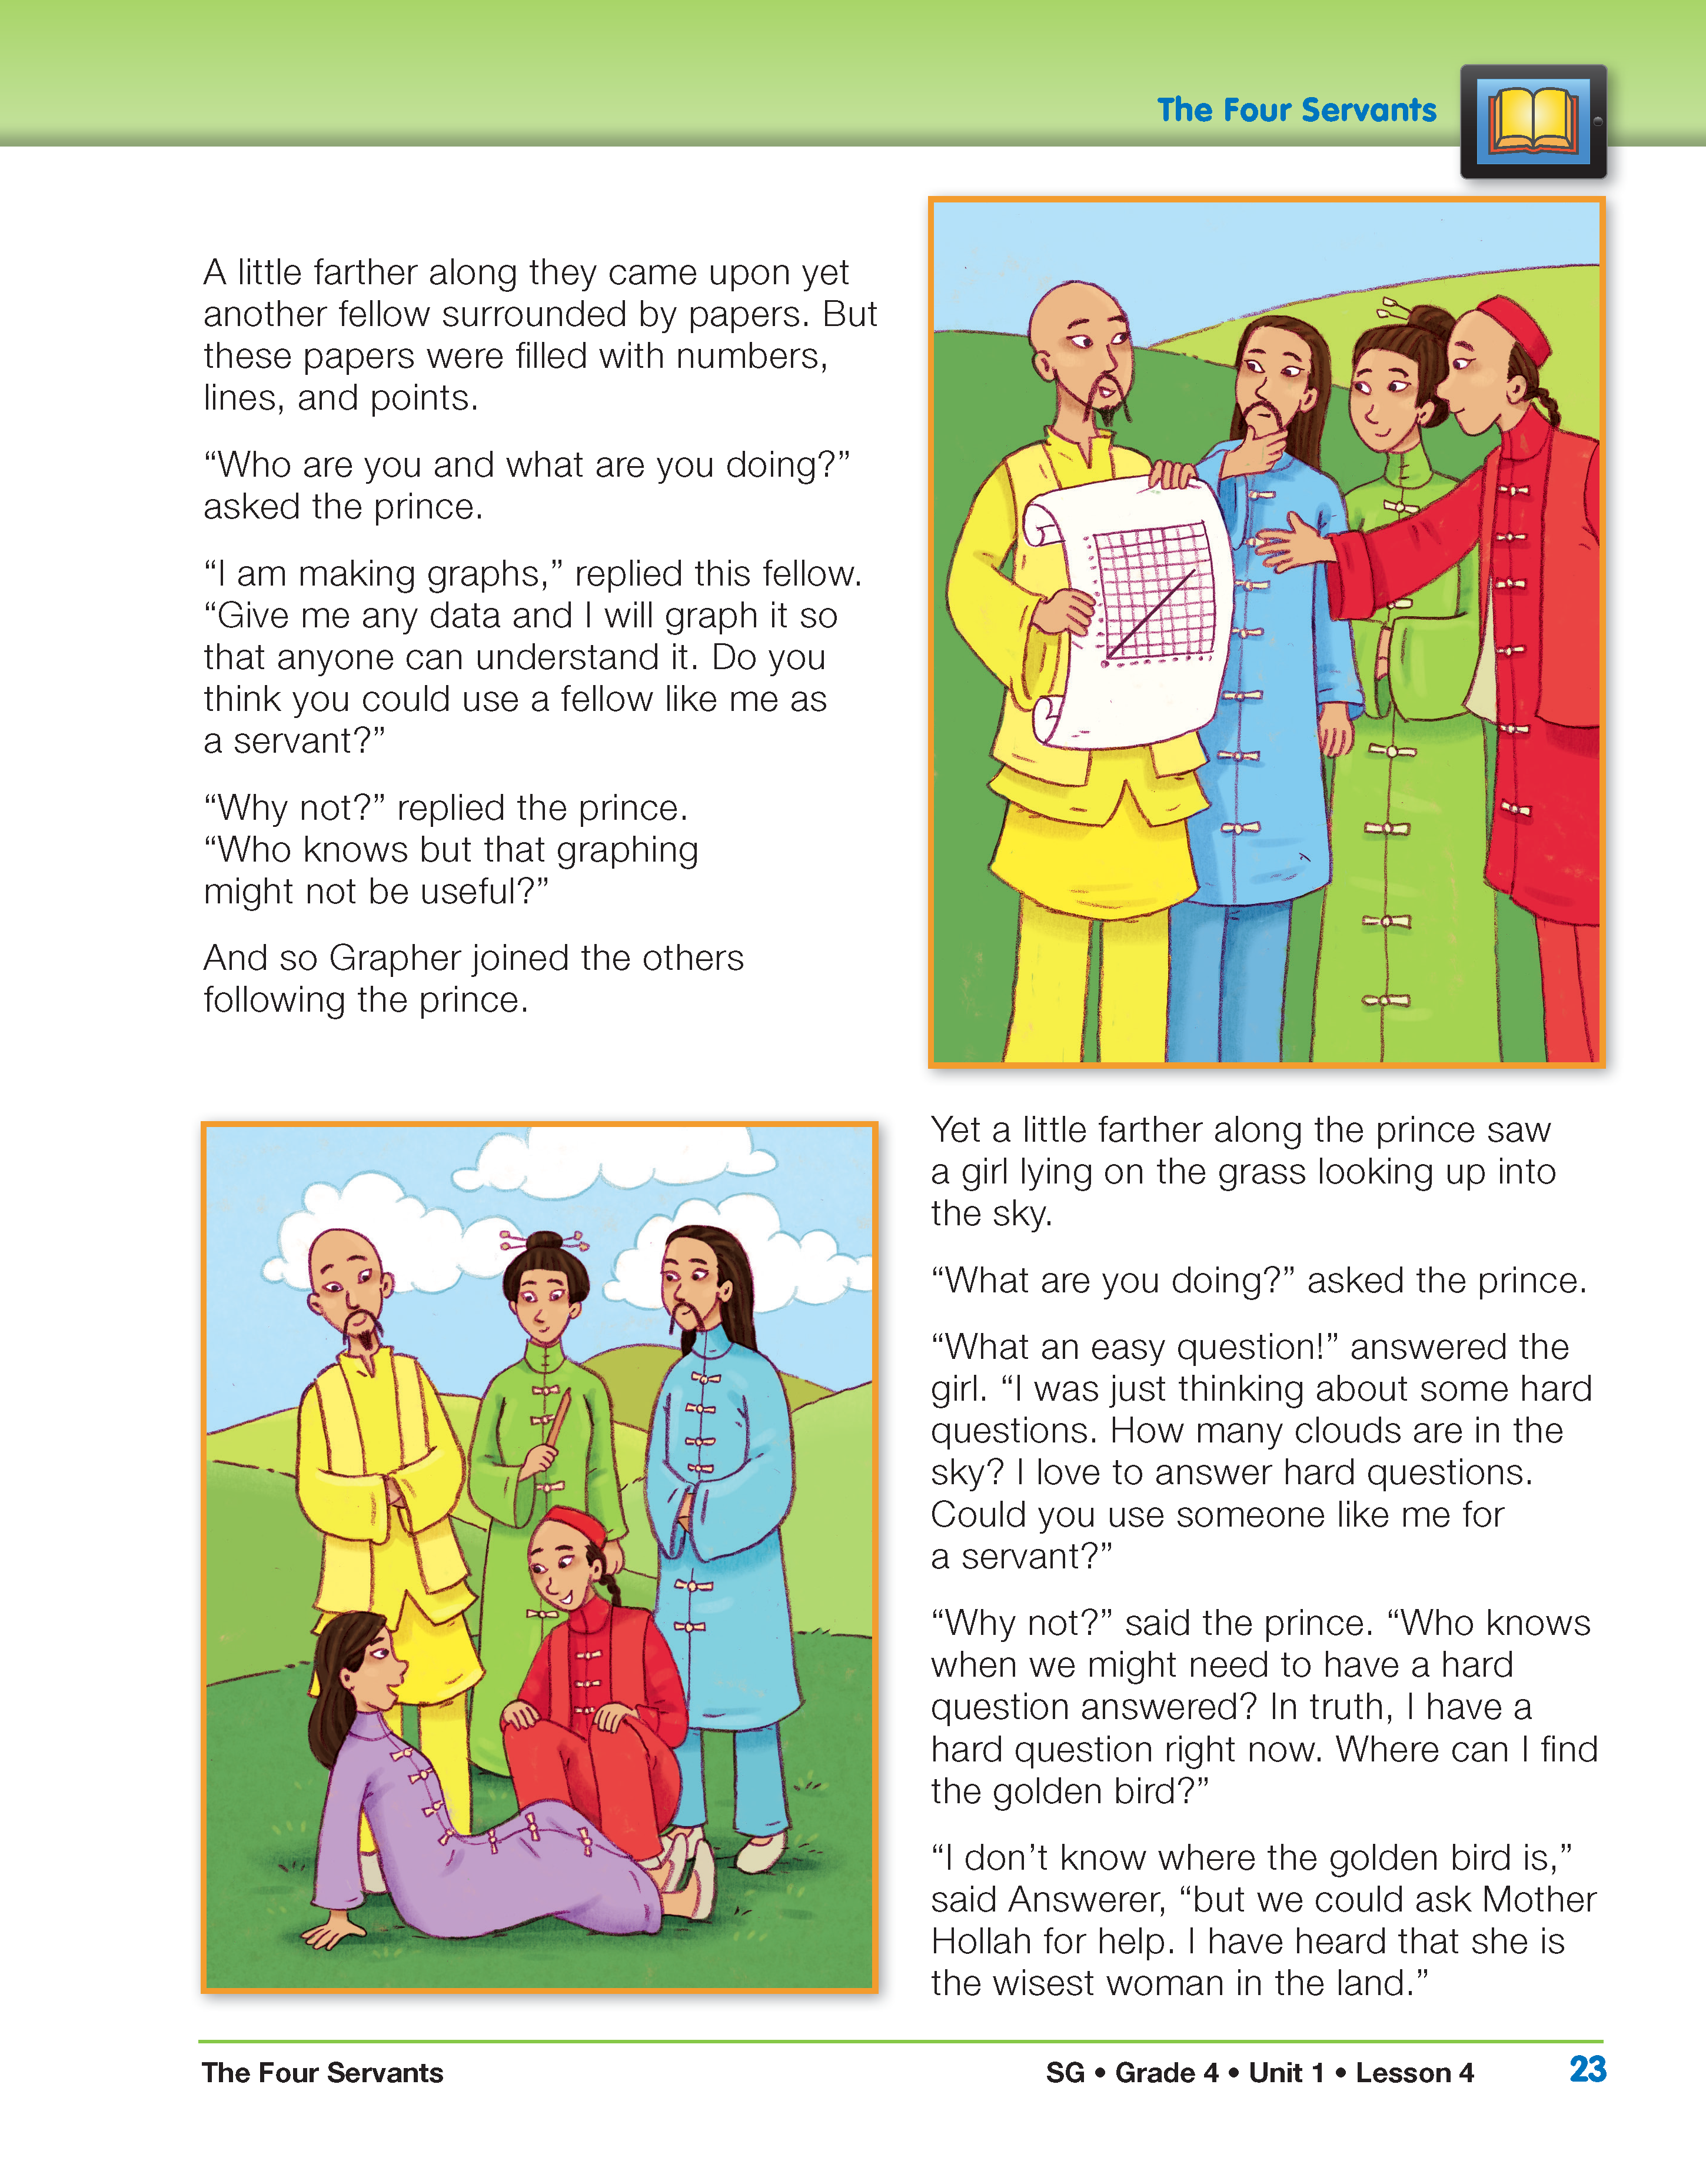
- Does the graph that Grapher is plotting look familiar? When have you seen a graph like this? (Answers will vary. Students using Math Trailblazers in third grade made point graphs similar to this. Third-grade examples include Walking Around Shapes and Mass vs. Number.)
- How would you answer the question, “How many clouds are in the sky?” (Answers will vary. This is a very hard question to answer. Clouds form and disappear. Not all places in the world have clouds at the same time or have clouds in the same quantity. Students might suggest counting the number of clouds in a small section and using it to generalize the amount of clouds all over the world.)

Questions like this one—questions with answers that are difficult or impossible to verify—are sometimes called Fermi questions after the great physicist Enrico Fermi. One of Fermi's favorites was, “How many piano tuners are there in Chicago?” Another example is, “How many leaves are on a fully grown elm tree?” Fermi questions can help students improve their estimation skills.
Page 24
- About how many meters tall would you guess the giant is? (Answers will vary. Later in the story the giant is found to be about 4 1/2 m tall. A 4th-grader may be about 140 cm in height, and an adult may be around 170 cm, so a reasonable estimate would be greater.)
- How would you figure out the giant's height? (Answers will vary. The approach taken by the prince and his servants is to find the relationship between hand length and height and then to use this relationship to find the giant's height.)
- Does anyone have a different estimate? A different strategy for figuring it out? (Other approaches are plausible, particularly if they depend on scaling up from humans to the giant.)
- How do you think the prince will figure out how tall the giant is? (Answers will vary. Getting students to make predictions about how a story will end is a good way to engage them in the reading.)
Page 25
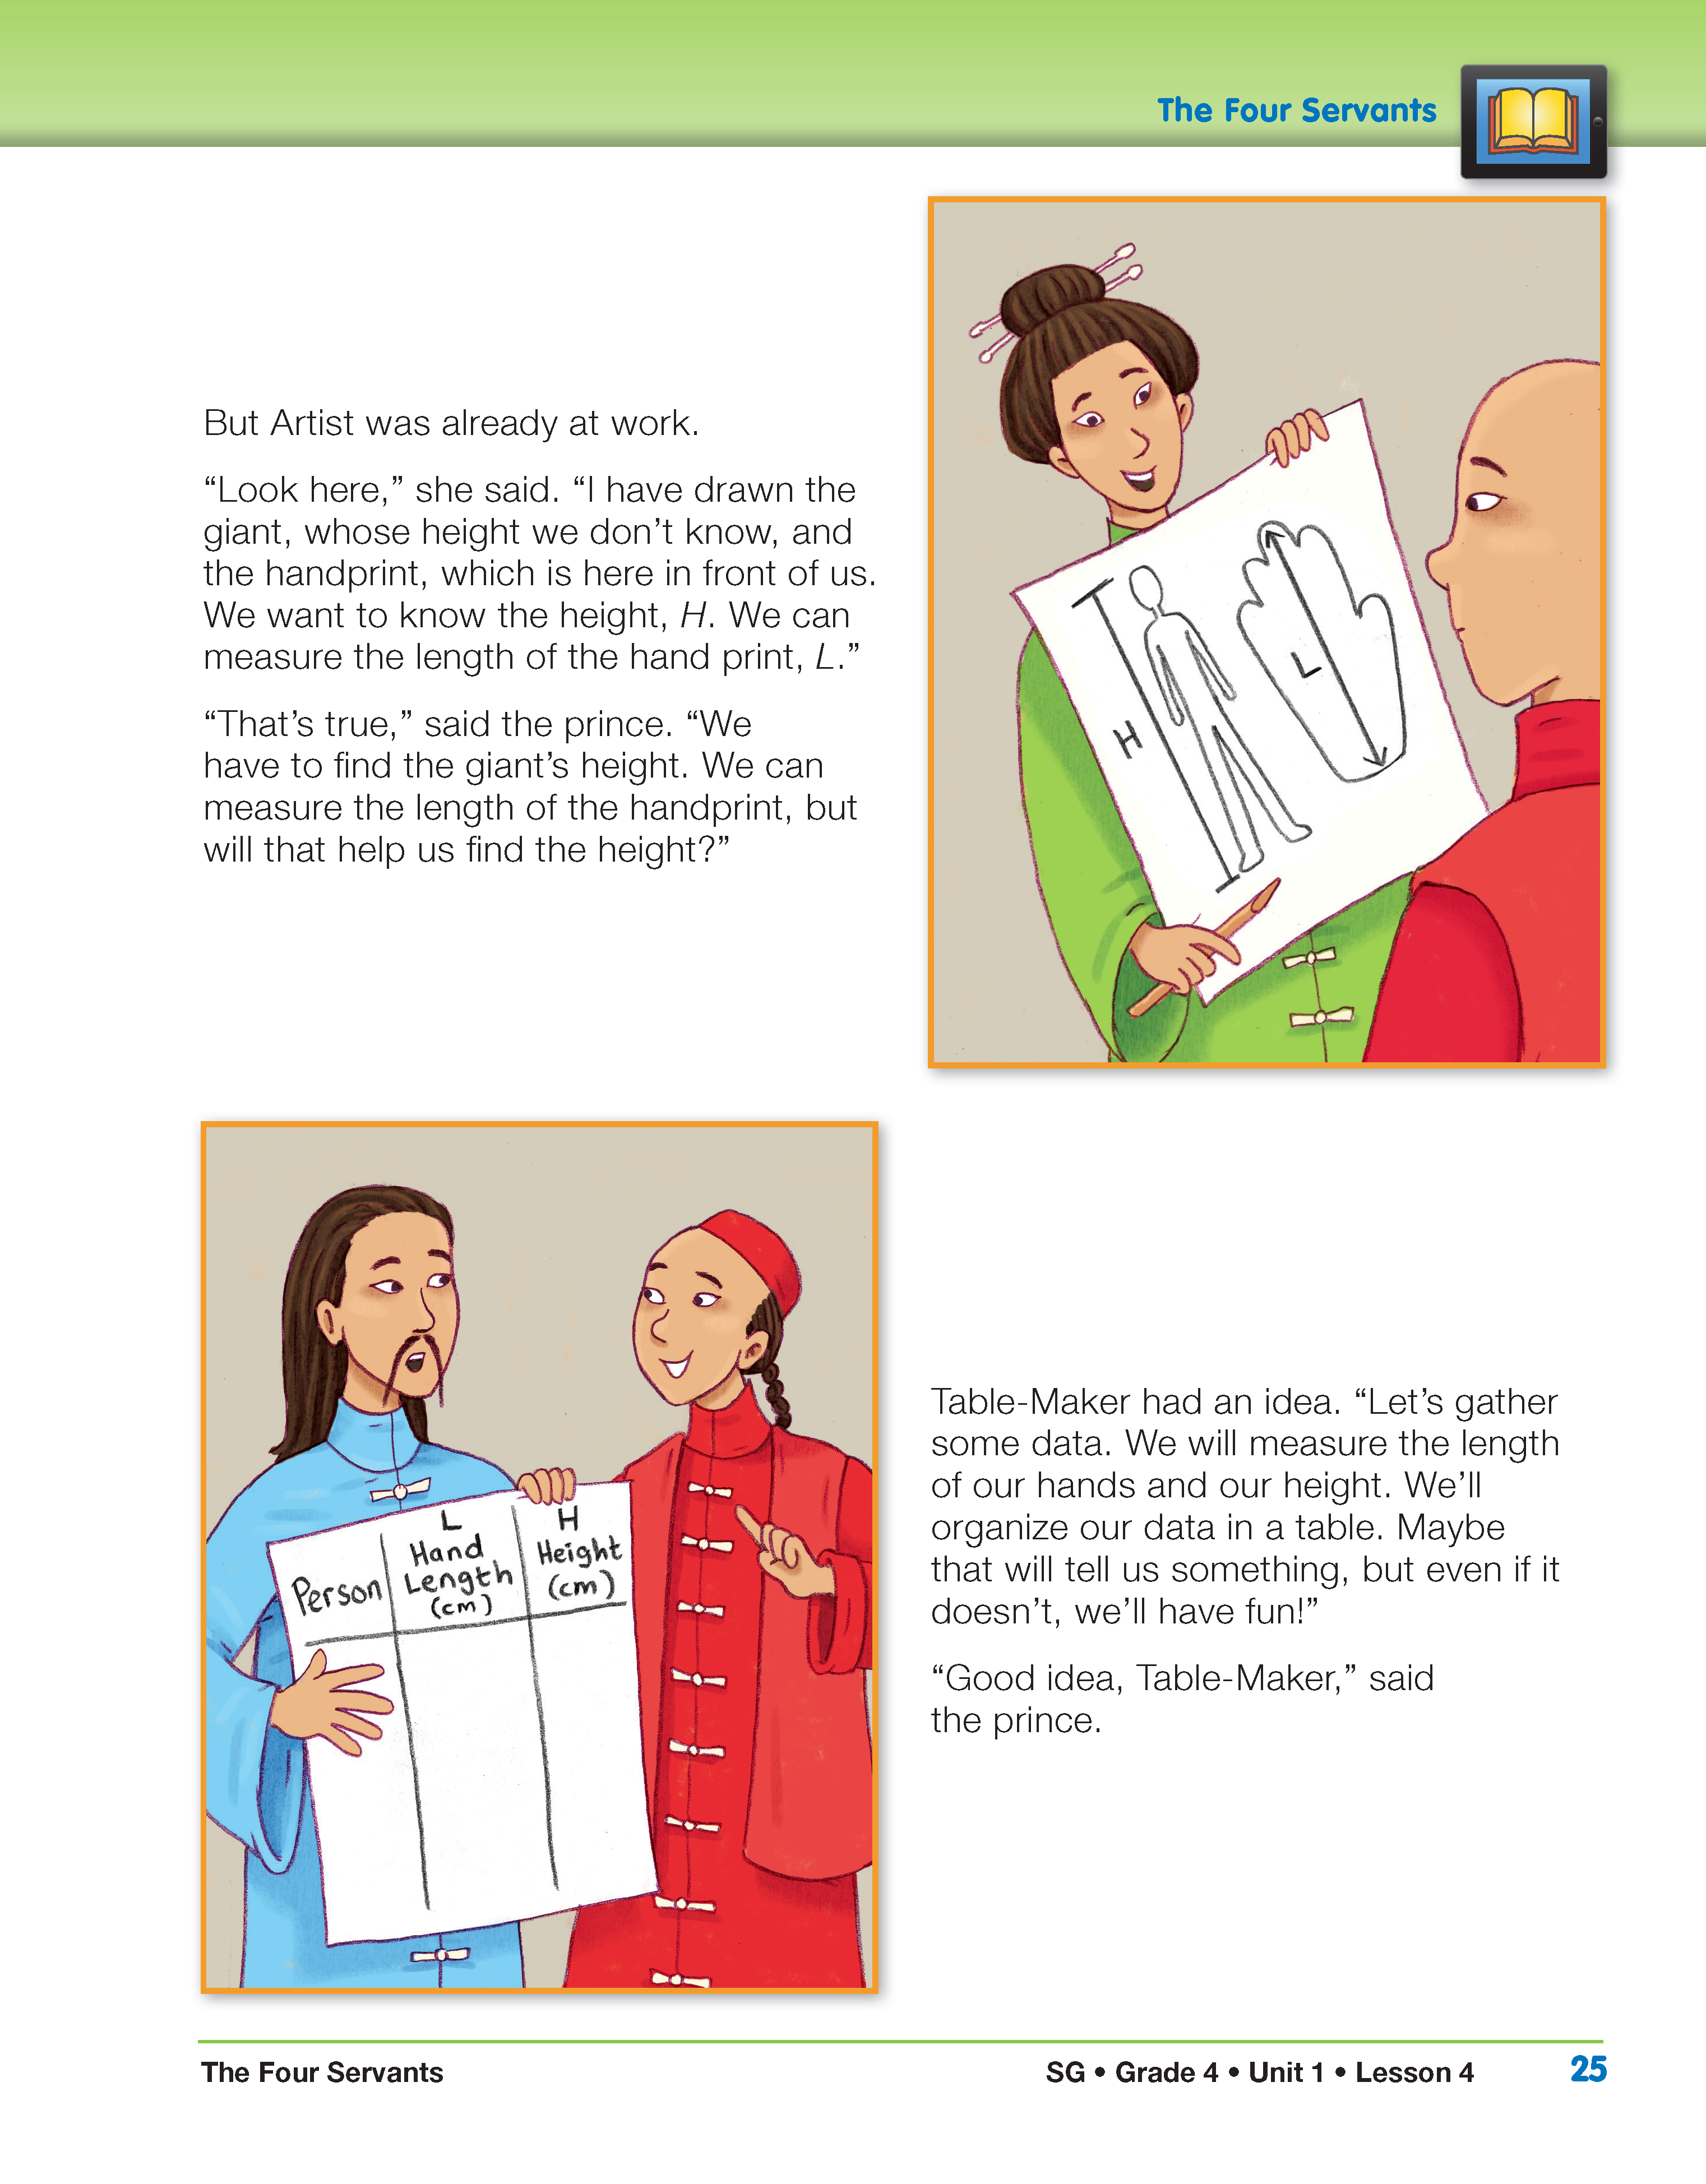
- What are the two variables that Artist has identified? (Hand length (L), and height (H))
- Why did she choose those two variables? (One is what the prince knows already and the other is what the prince wants to find out.)
Page 26
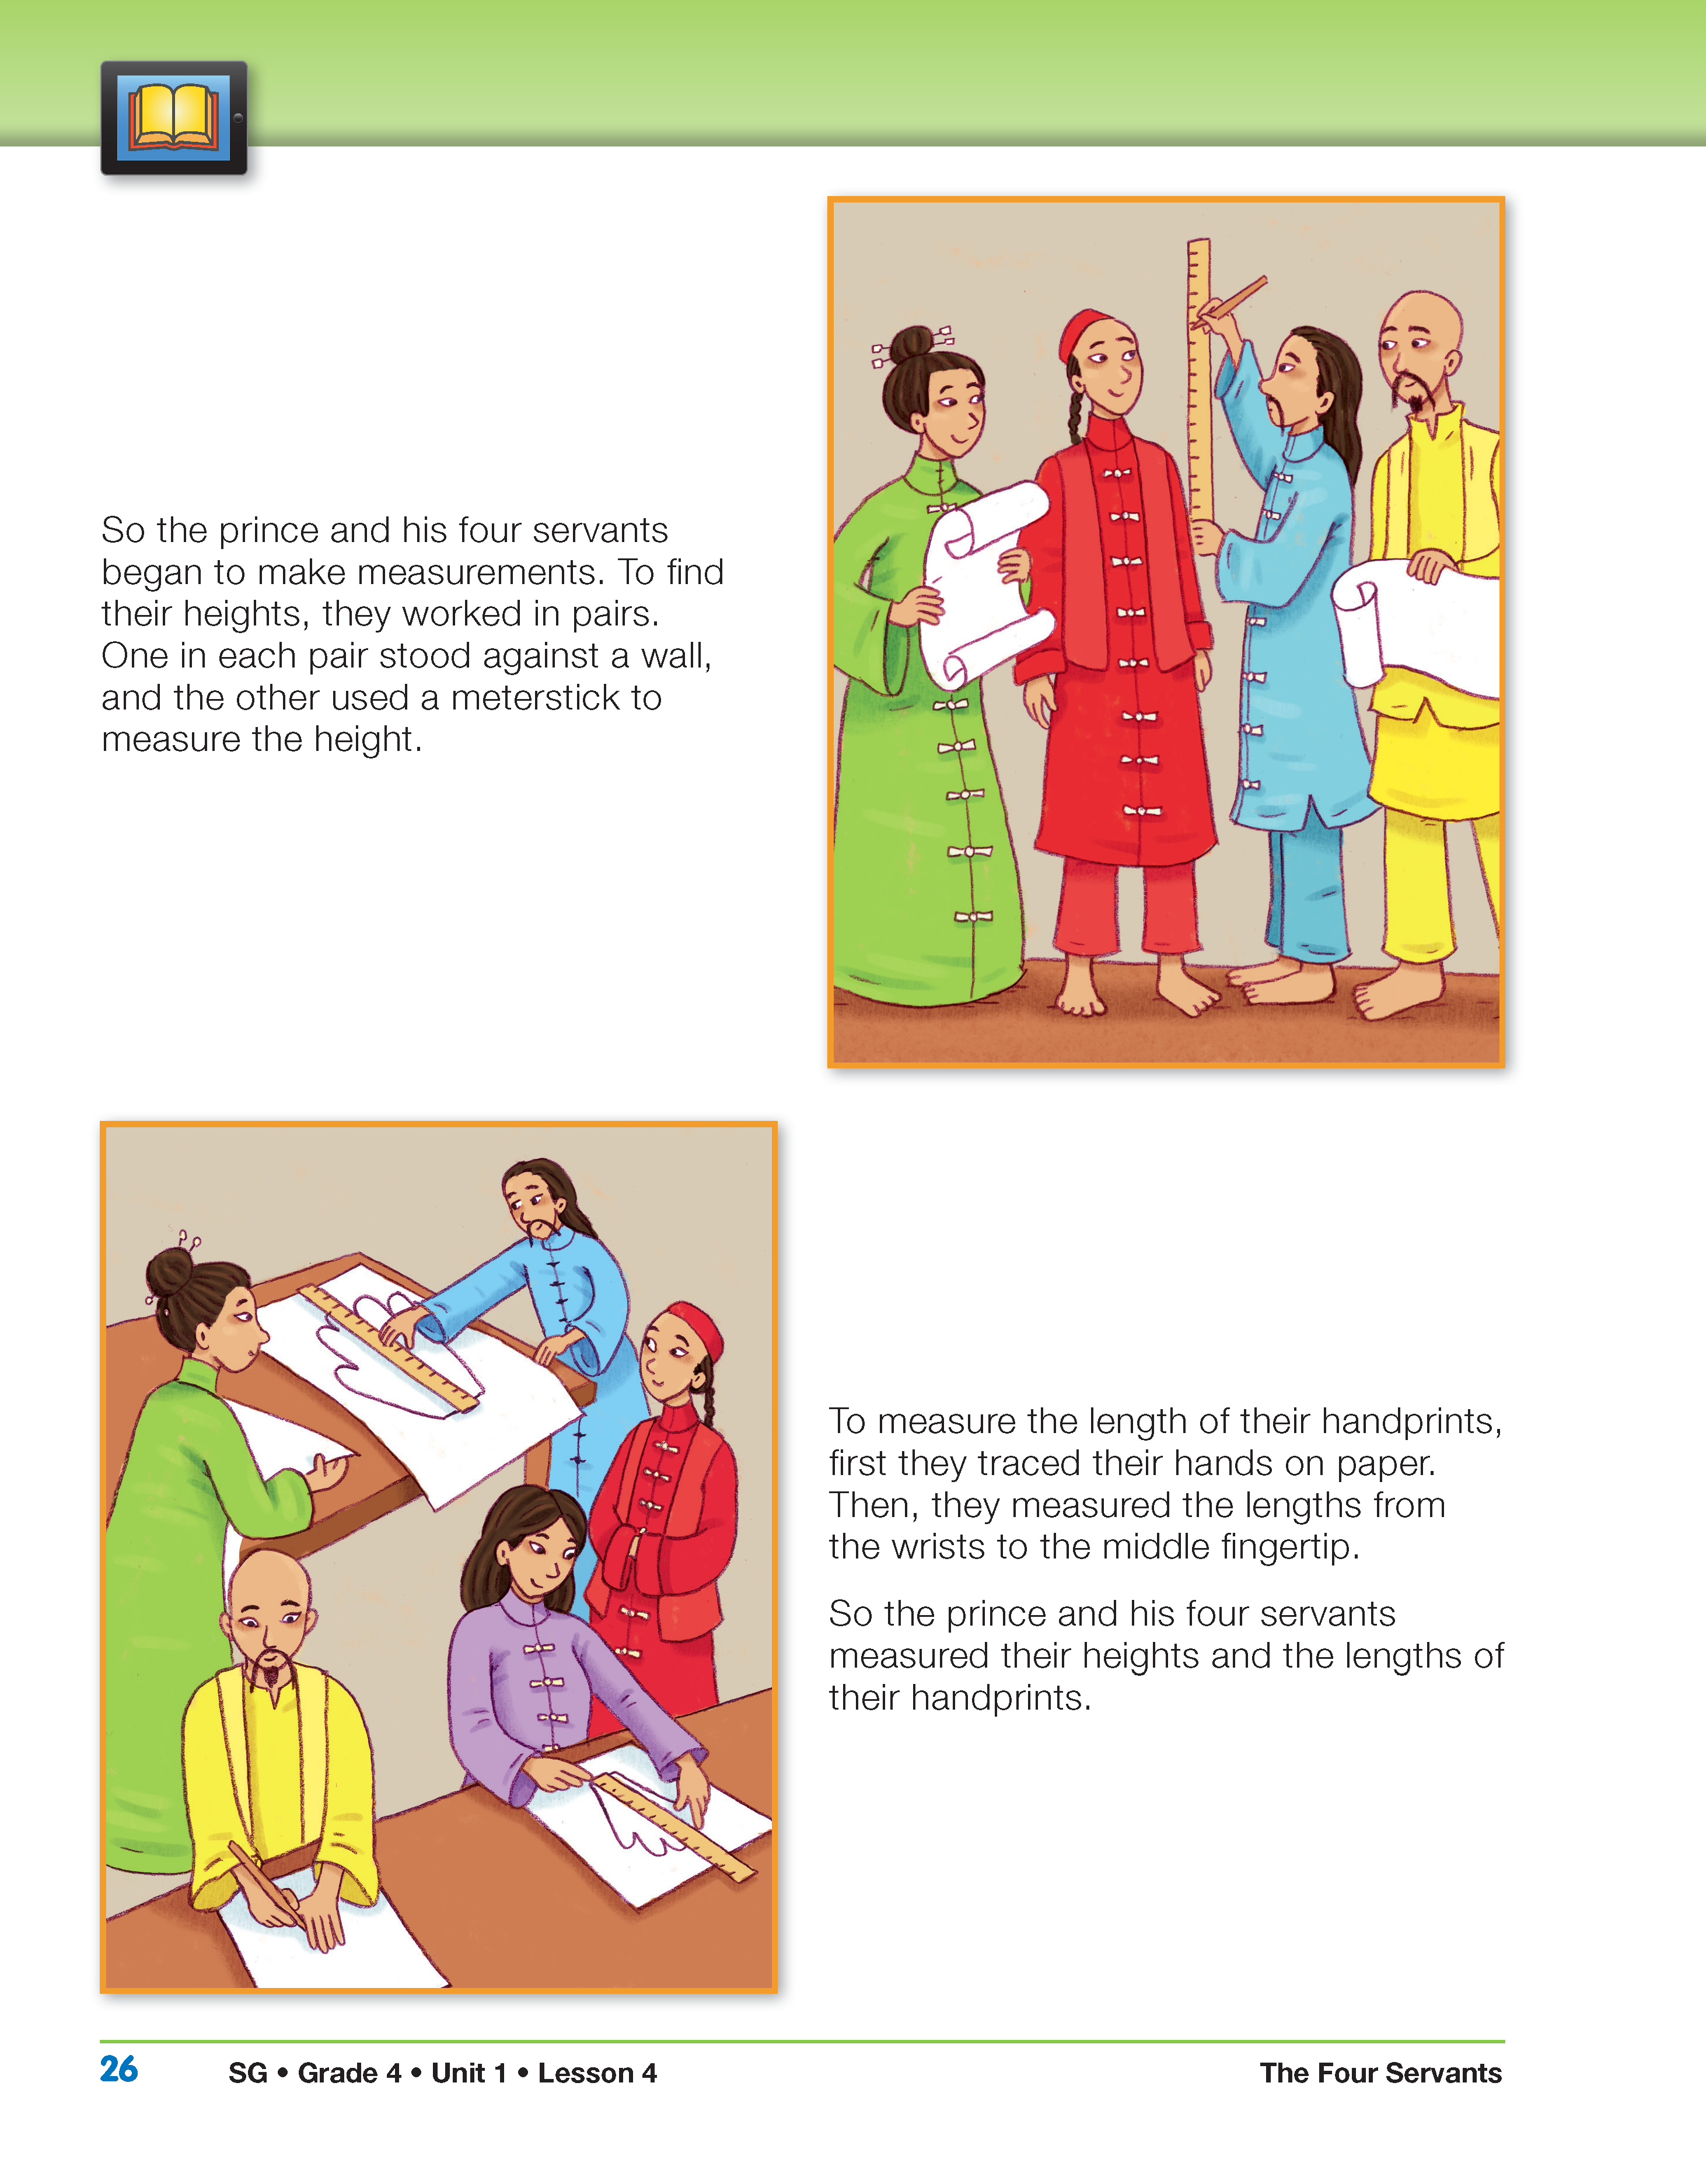
- Would knowing the length of someone's hand help you predict that person's height? Why or why not? (Yes. Because people with longer hands are usually taller.)
- Why do you think that happens? (Possible response: Because as a person's height grows, most of his body parts do too.)
- Would knowing the length of someone's name help you predict that person's height? Why or why not? (No. Because there is no relationship between a person's name length and his or her height.)
- How do you know? (Possible response: Because babies can have really long names and tall adults can have really short names.)
Page 27
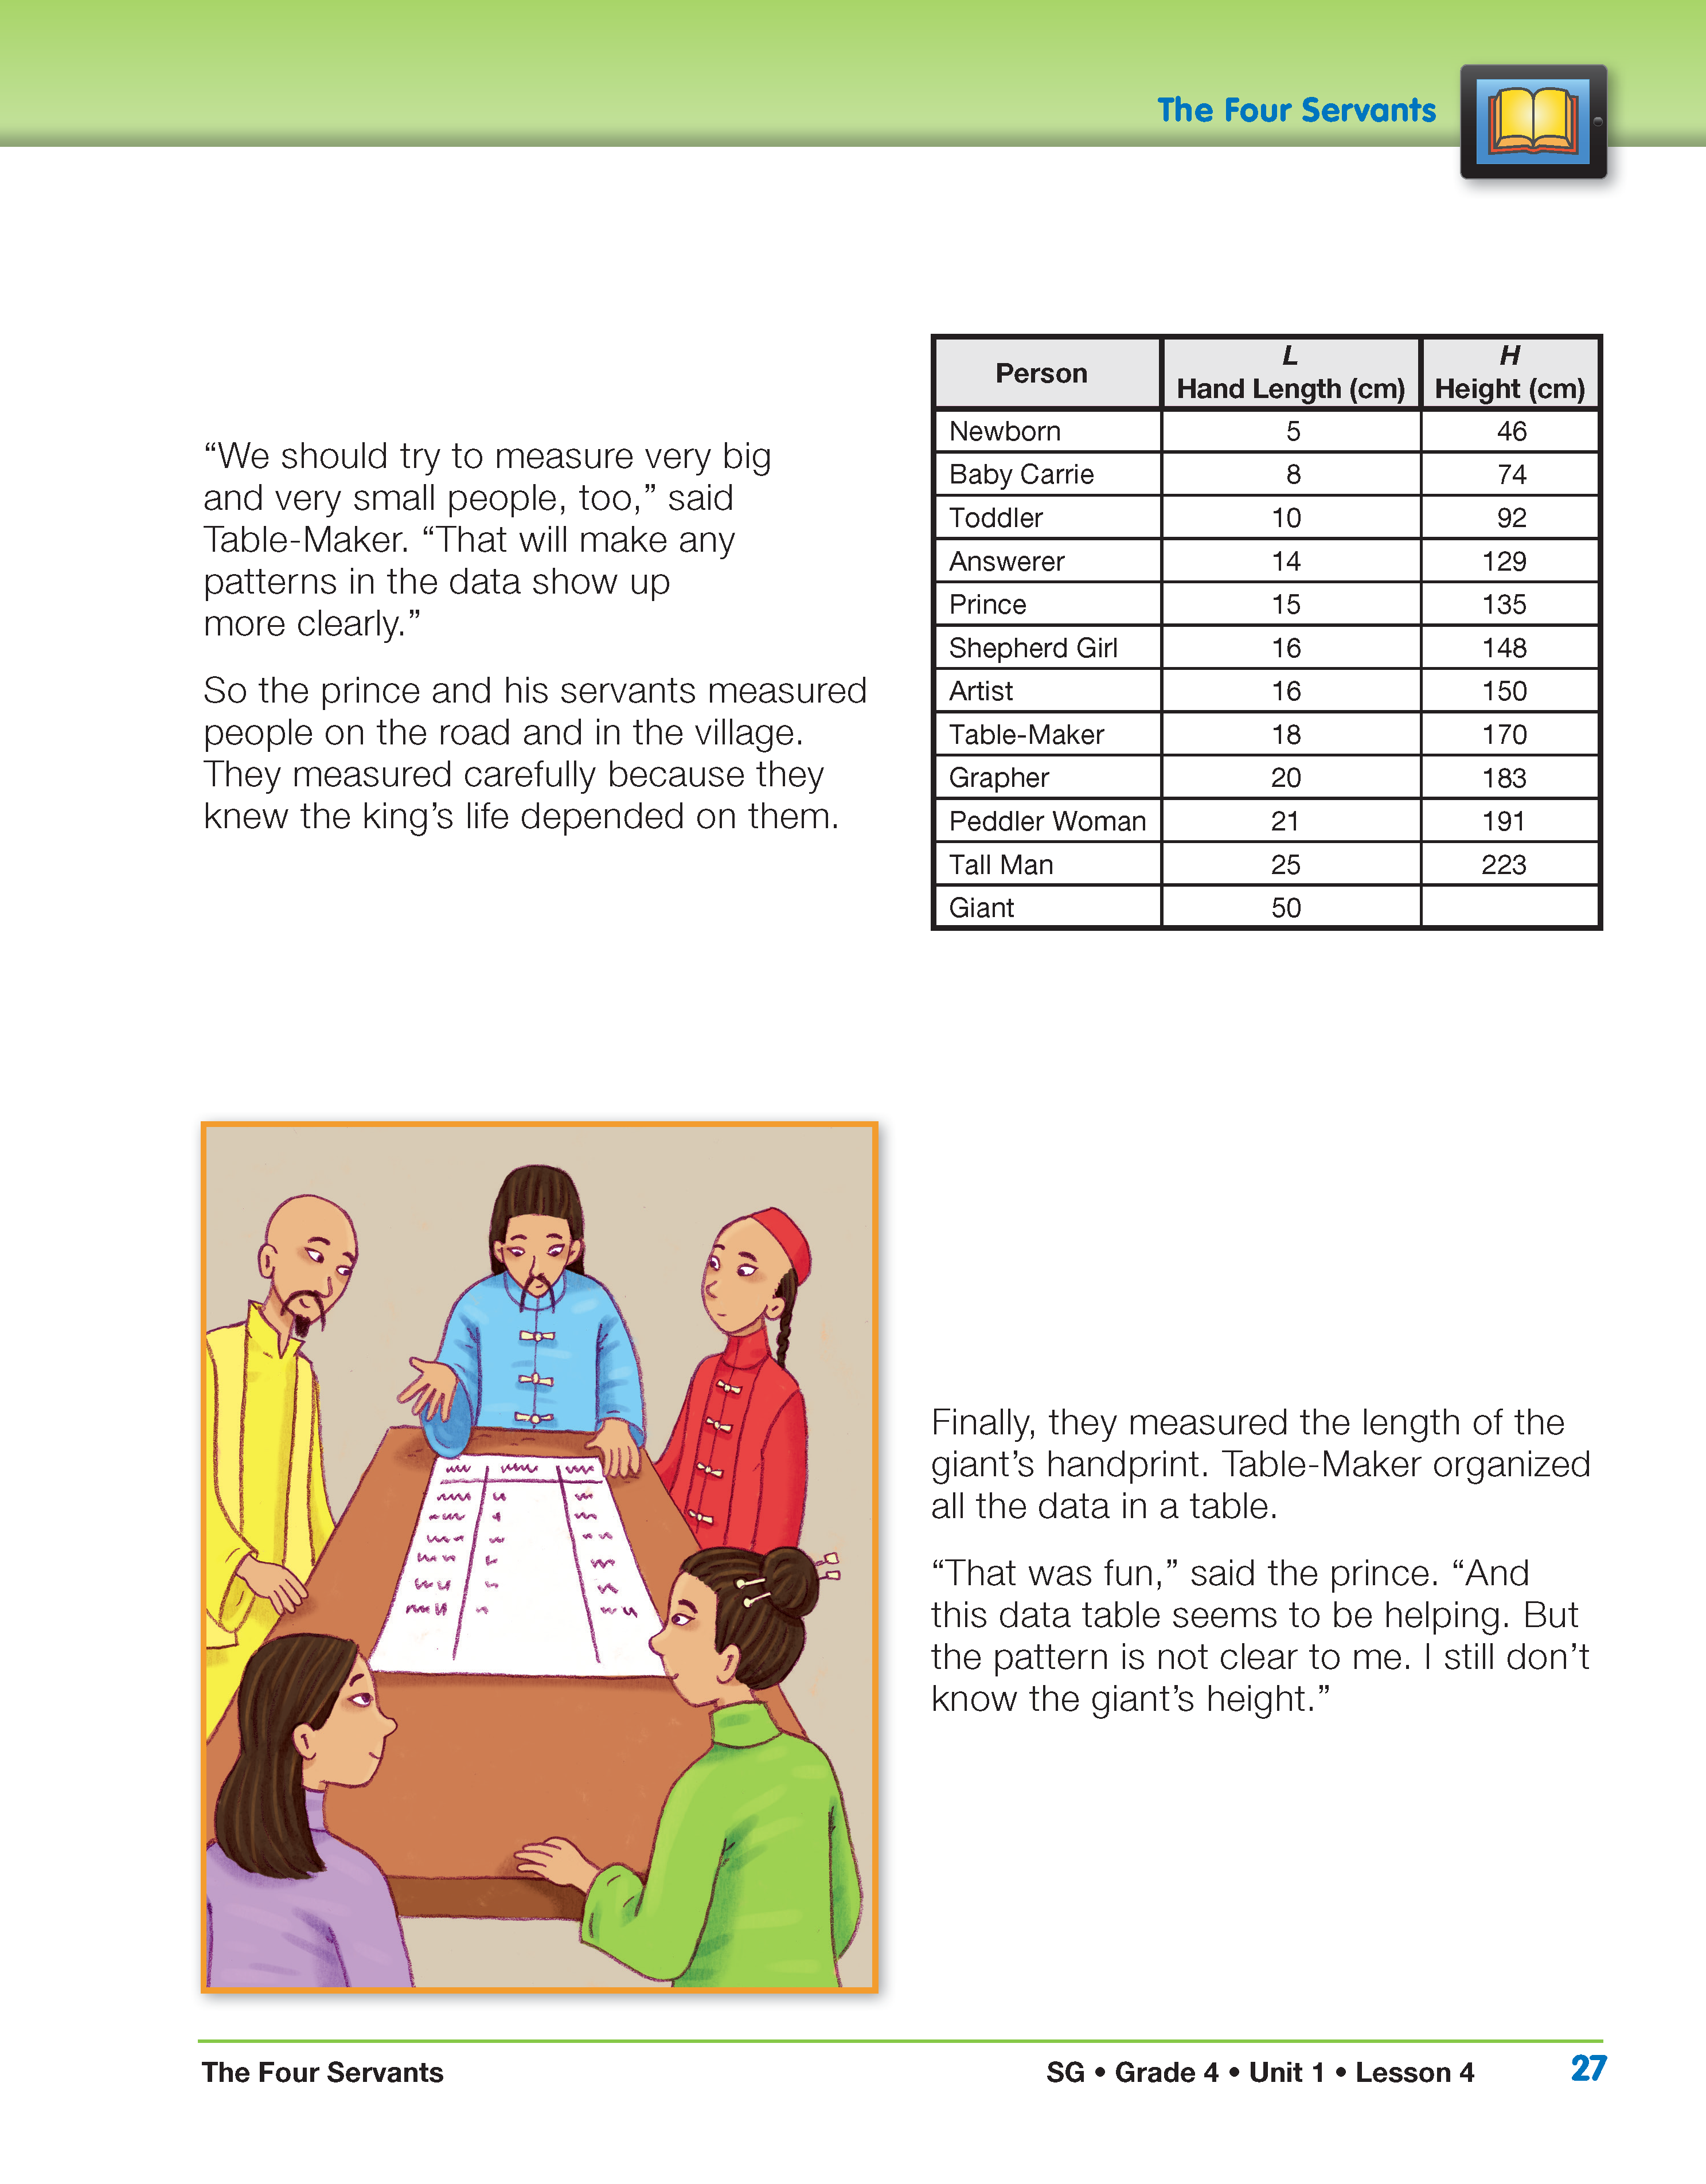
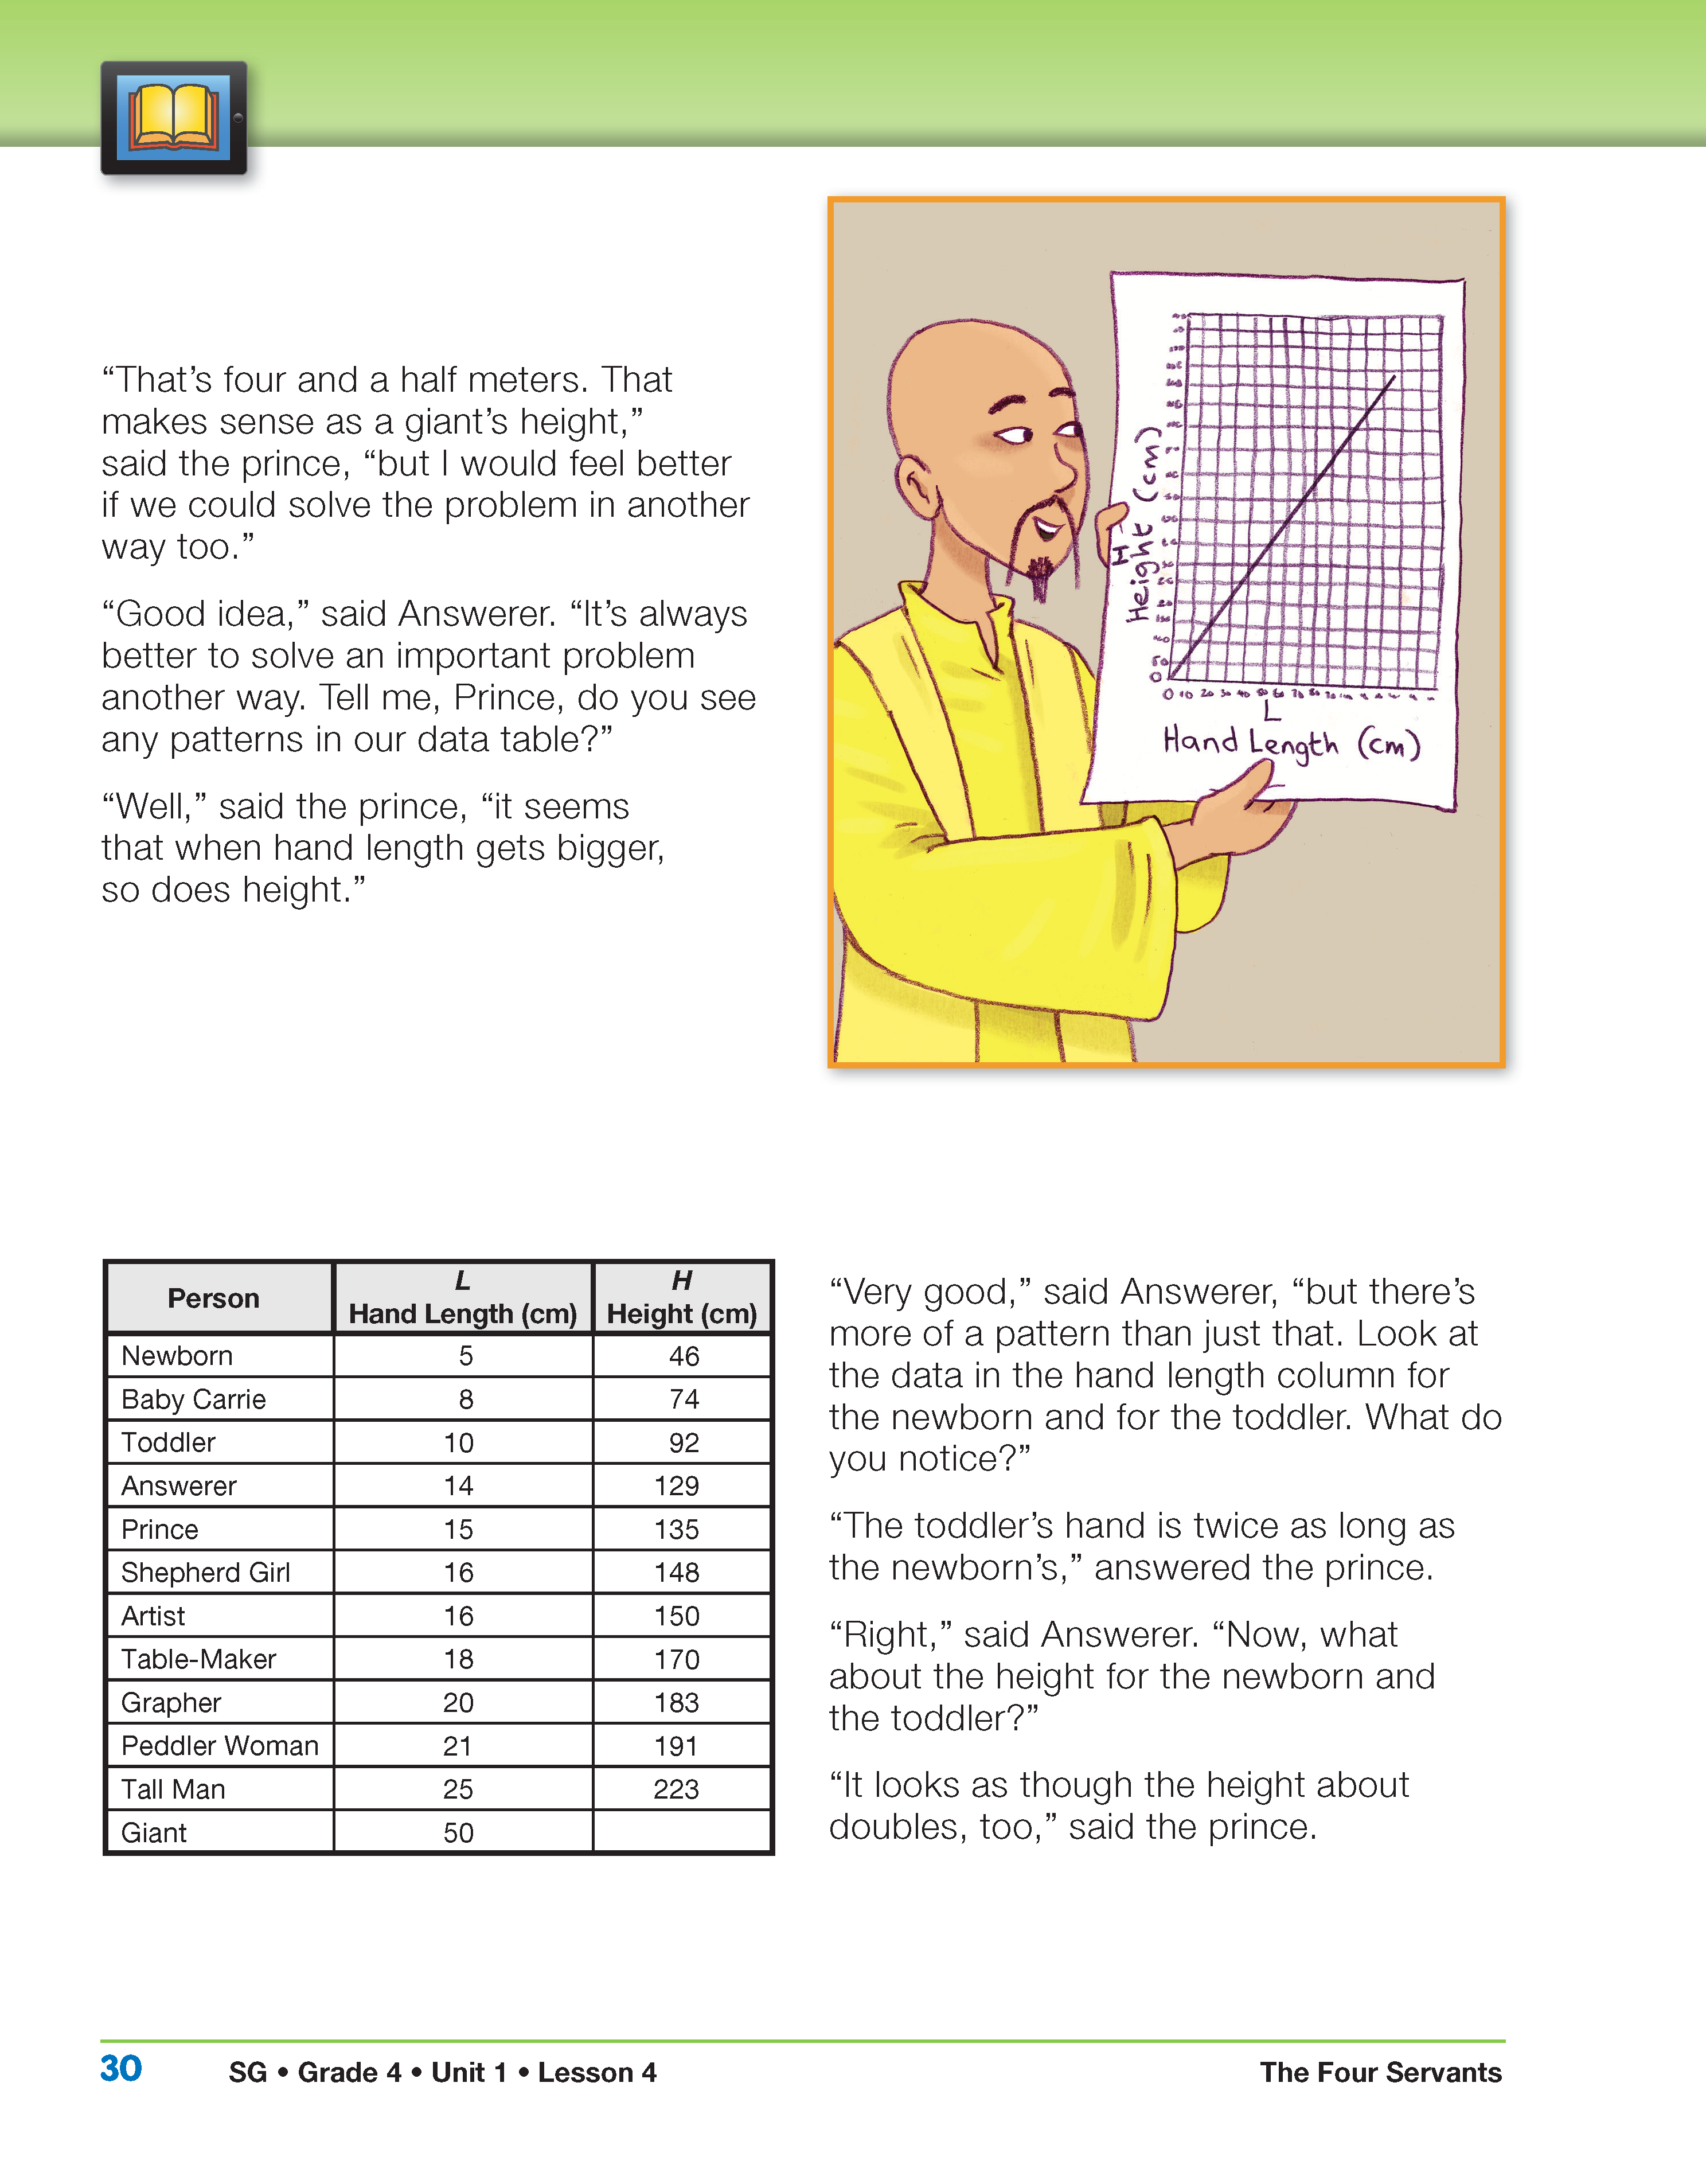
- What patterns do you notice when you look down the columns in Table-Maker's table? (Answers will vary. The most important pattern for the purpose of the story is the relationship that exists between hand length and height. Whenever either hand length or height doubles, the other does also.)
- What patterns do you see across the rows? (Students may note that the height is always about 9 times greater than the hand length. If they have difficulty discovering this direct them to the relationship between 5 and “a number close to 46,” or 45. Help students identify that this is close to 5 × 9 = 45. Then do the same with 8 and 74, which is close to 9 times 8, or 72, and 10 and 92, which is close to 9 × 10 = 90.)
Page 28
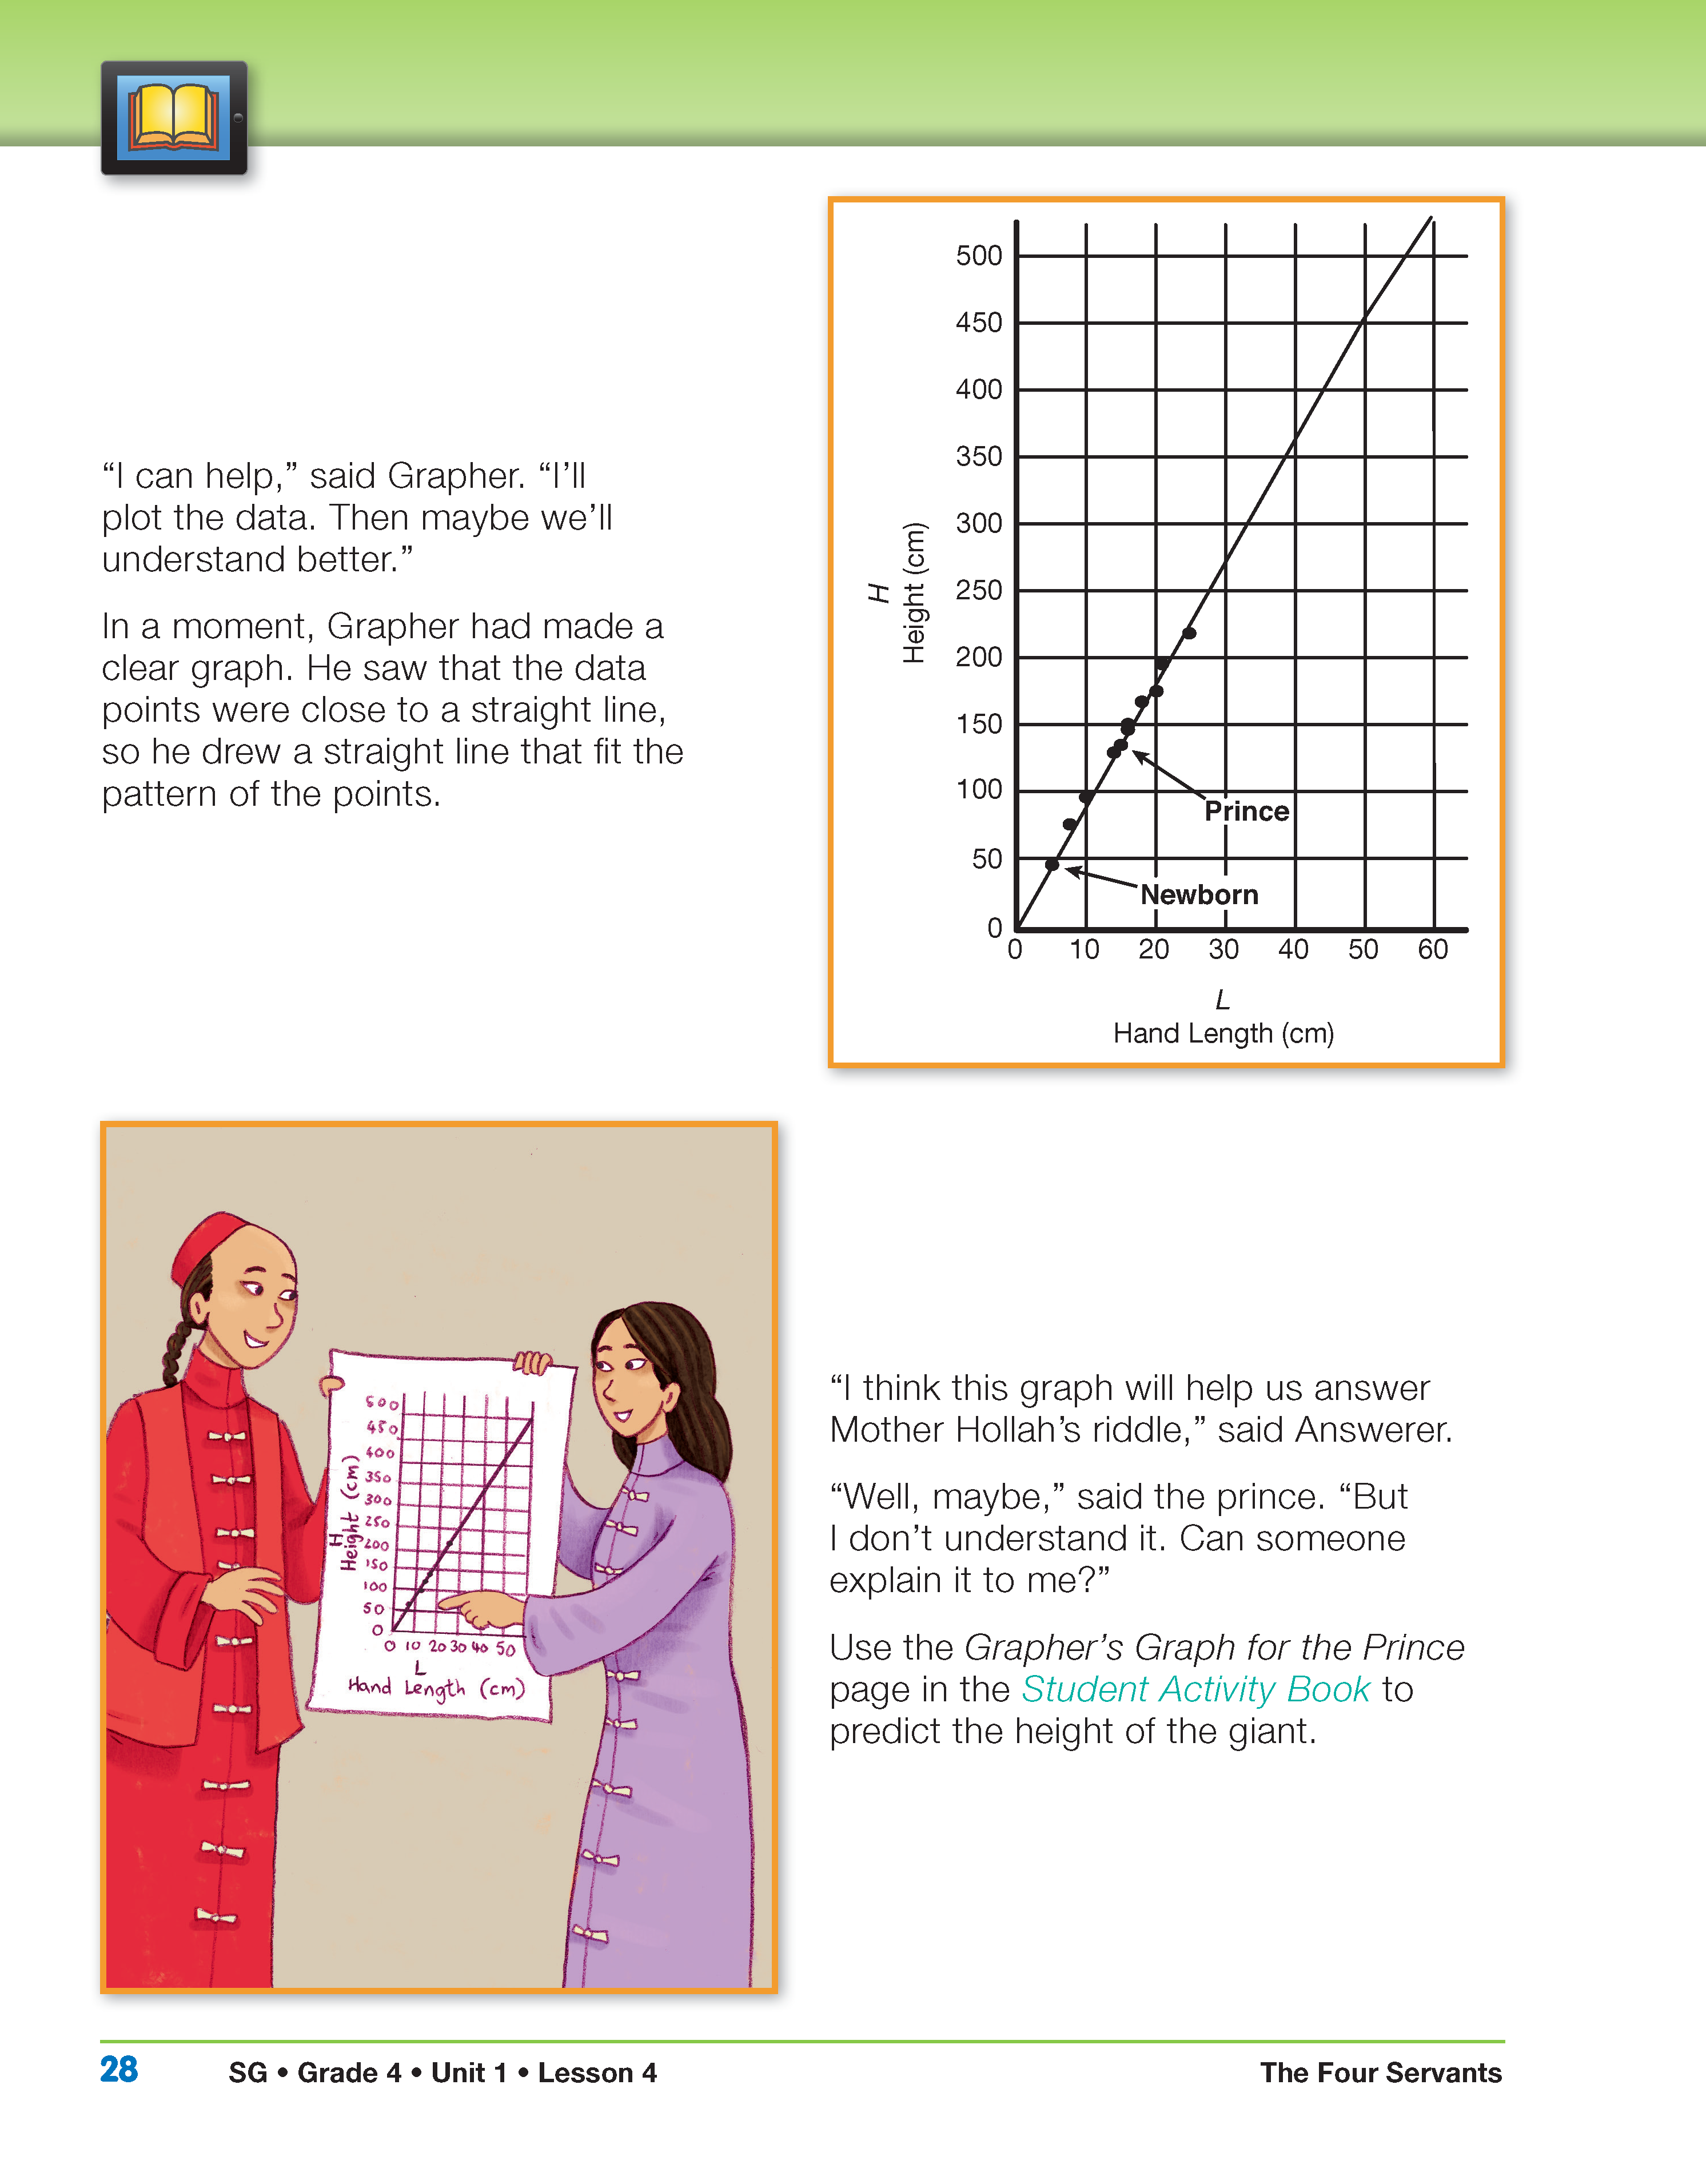
- Compare the graph and the data table. Which one would you use to solve the problem? (Answers will vary. If students have noticed that the data table shows that the height is about 9 times the hand length, they could use the data table to estimate the giant's height. The graph makes the pattern clearer and shows that as the hand length increases, so does the height.)
- Why did the Grapher draw a line through the data points? (Possible response: It makes the pattern clearer.)
Analyze the Grapher's Graph. After reading and discussing this page (and before turning the page), have students look at The Grapher's Graph for the Prince in the Student Activity Book and use the class display you prepared.
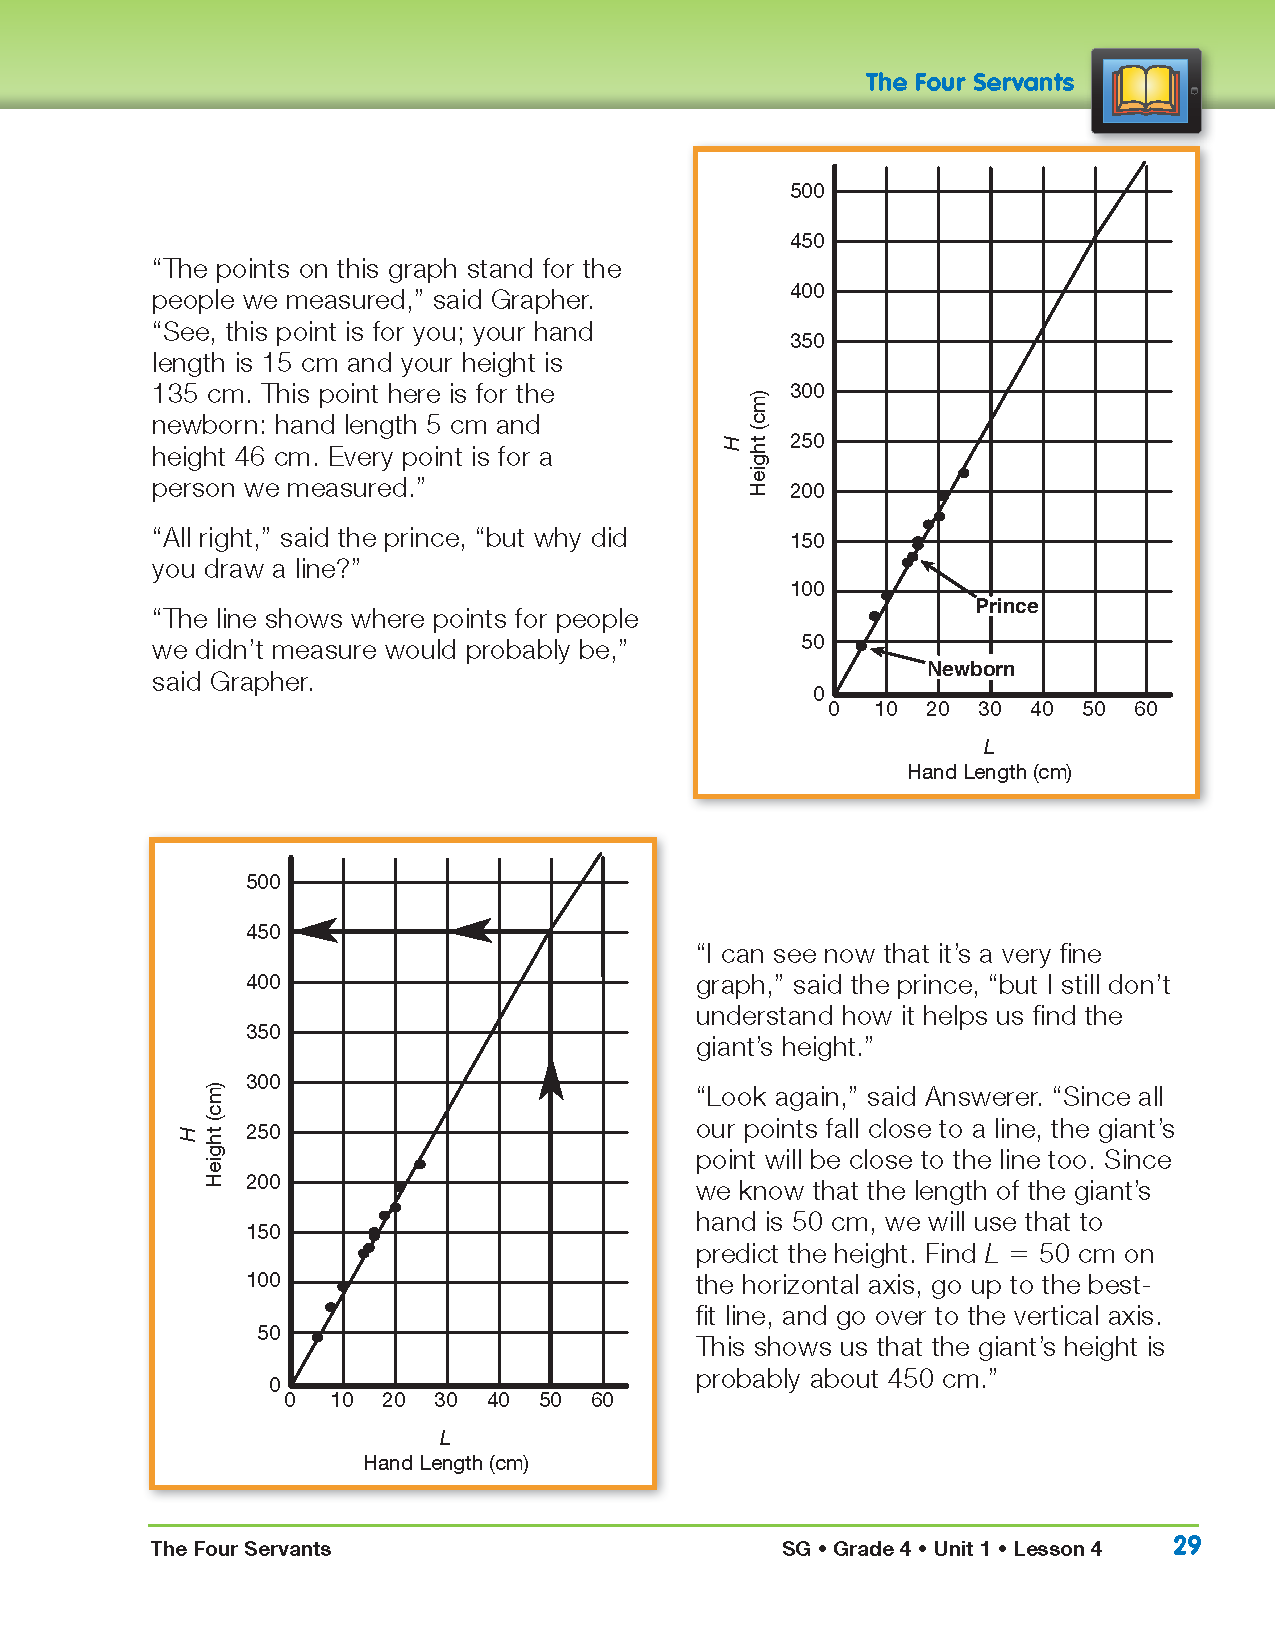
- How can the prince use this graph to predict the height of the giant? (Have students work in pairs to make their predictions and to show on the graph how their predictions were made.)
- How could the prince show on this graph how he made his prediction?
Ask a student to demonstrate on the display of the graph. The student should trace with a finger or draw a dotted line from 50 cm on the horizontal axis straight up to the best-fit line drawn on the graph, then draw a dotted line to the left to the vertical axis. It should meet the vertical axis at about 450 cm. (See the second graph on page 29 of the story in the Student Guide.)
Continue reading and discussing the rest of The Four Servants in the Student Guide.
Page 29
- How does your graph compare with how Answerer marked her graph to make her estimate?
- How does your estimate compare?
- How did the prince use the graph to predict the giant's height? Remember the giant's hand length is 50 cm. (He found 50 cm on the horizontal axis, went straight up until he hit the best-fit line, then went straight over to the vertical axis, at 450 cm.)
- What is his prediction? (About 450 cm. Every 100 cm is 1 meter, so the giant is 4.5 m.)
- Would the giant be able to stand up straight in the classroom? (Probably not, unless the classroom has a very high ceiling. 450 cm is 4.5 meters or about 15 feet tall.)
Page 30
- What other patterns do you notice in the data table when you look down the columns? (There are many. One is the relationship between the data for Baby Carrie and the Shepherd Girl. The Shepherd Girl has a hand that is twice as long as Baby Carrie's and is also twice as tall.)
- What patterns do you notice when you look across the rows? (The heights are about nine times the hand lengths.)
Page 31
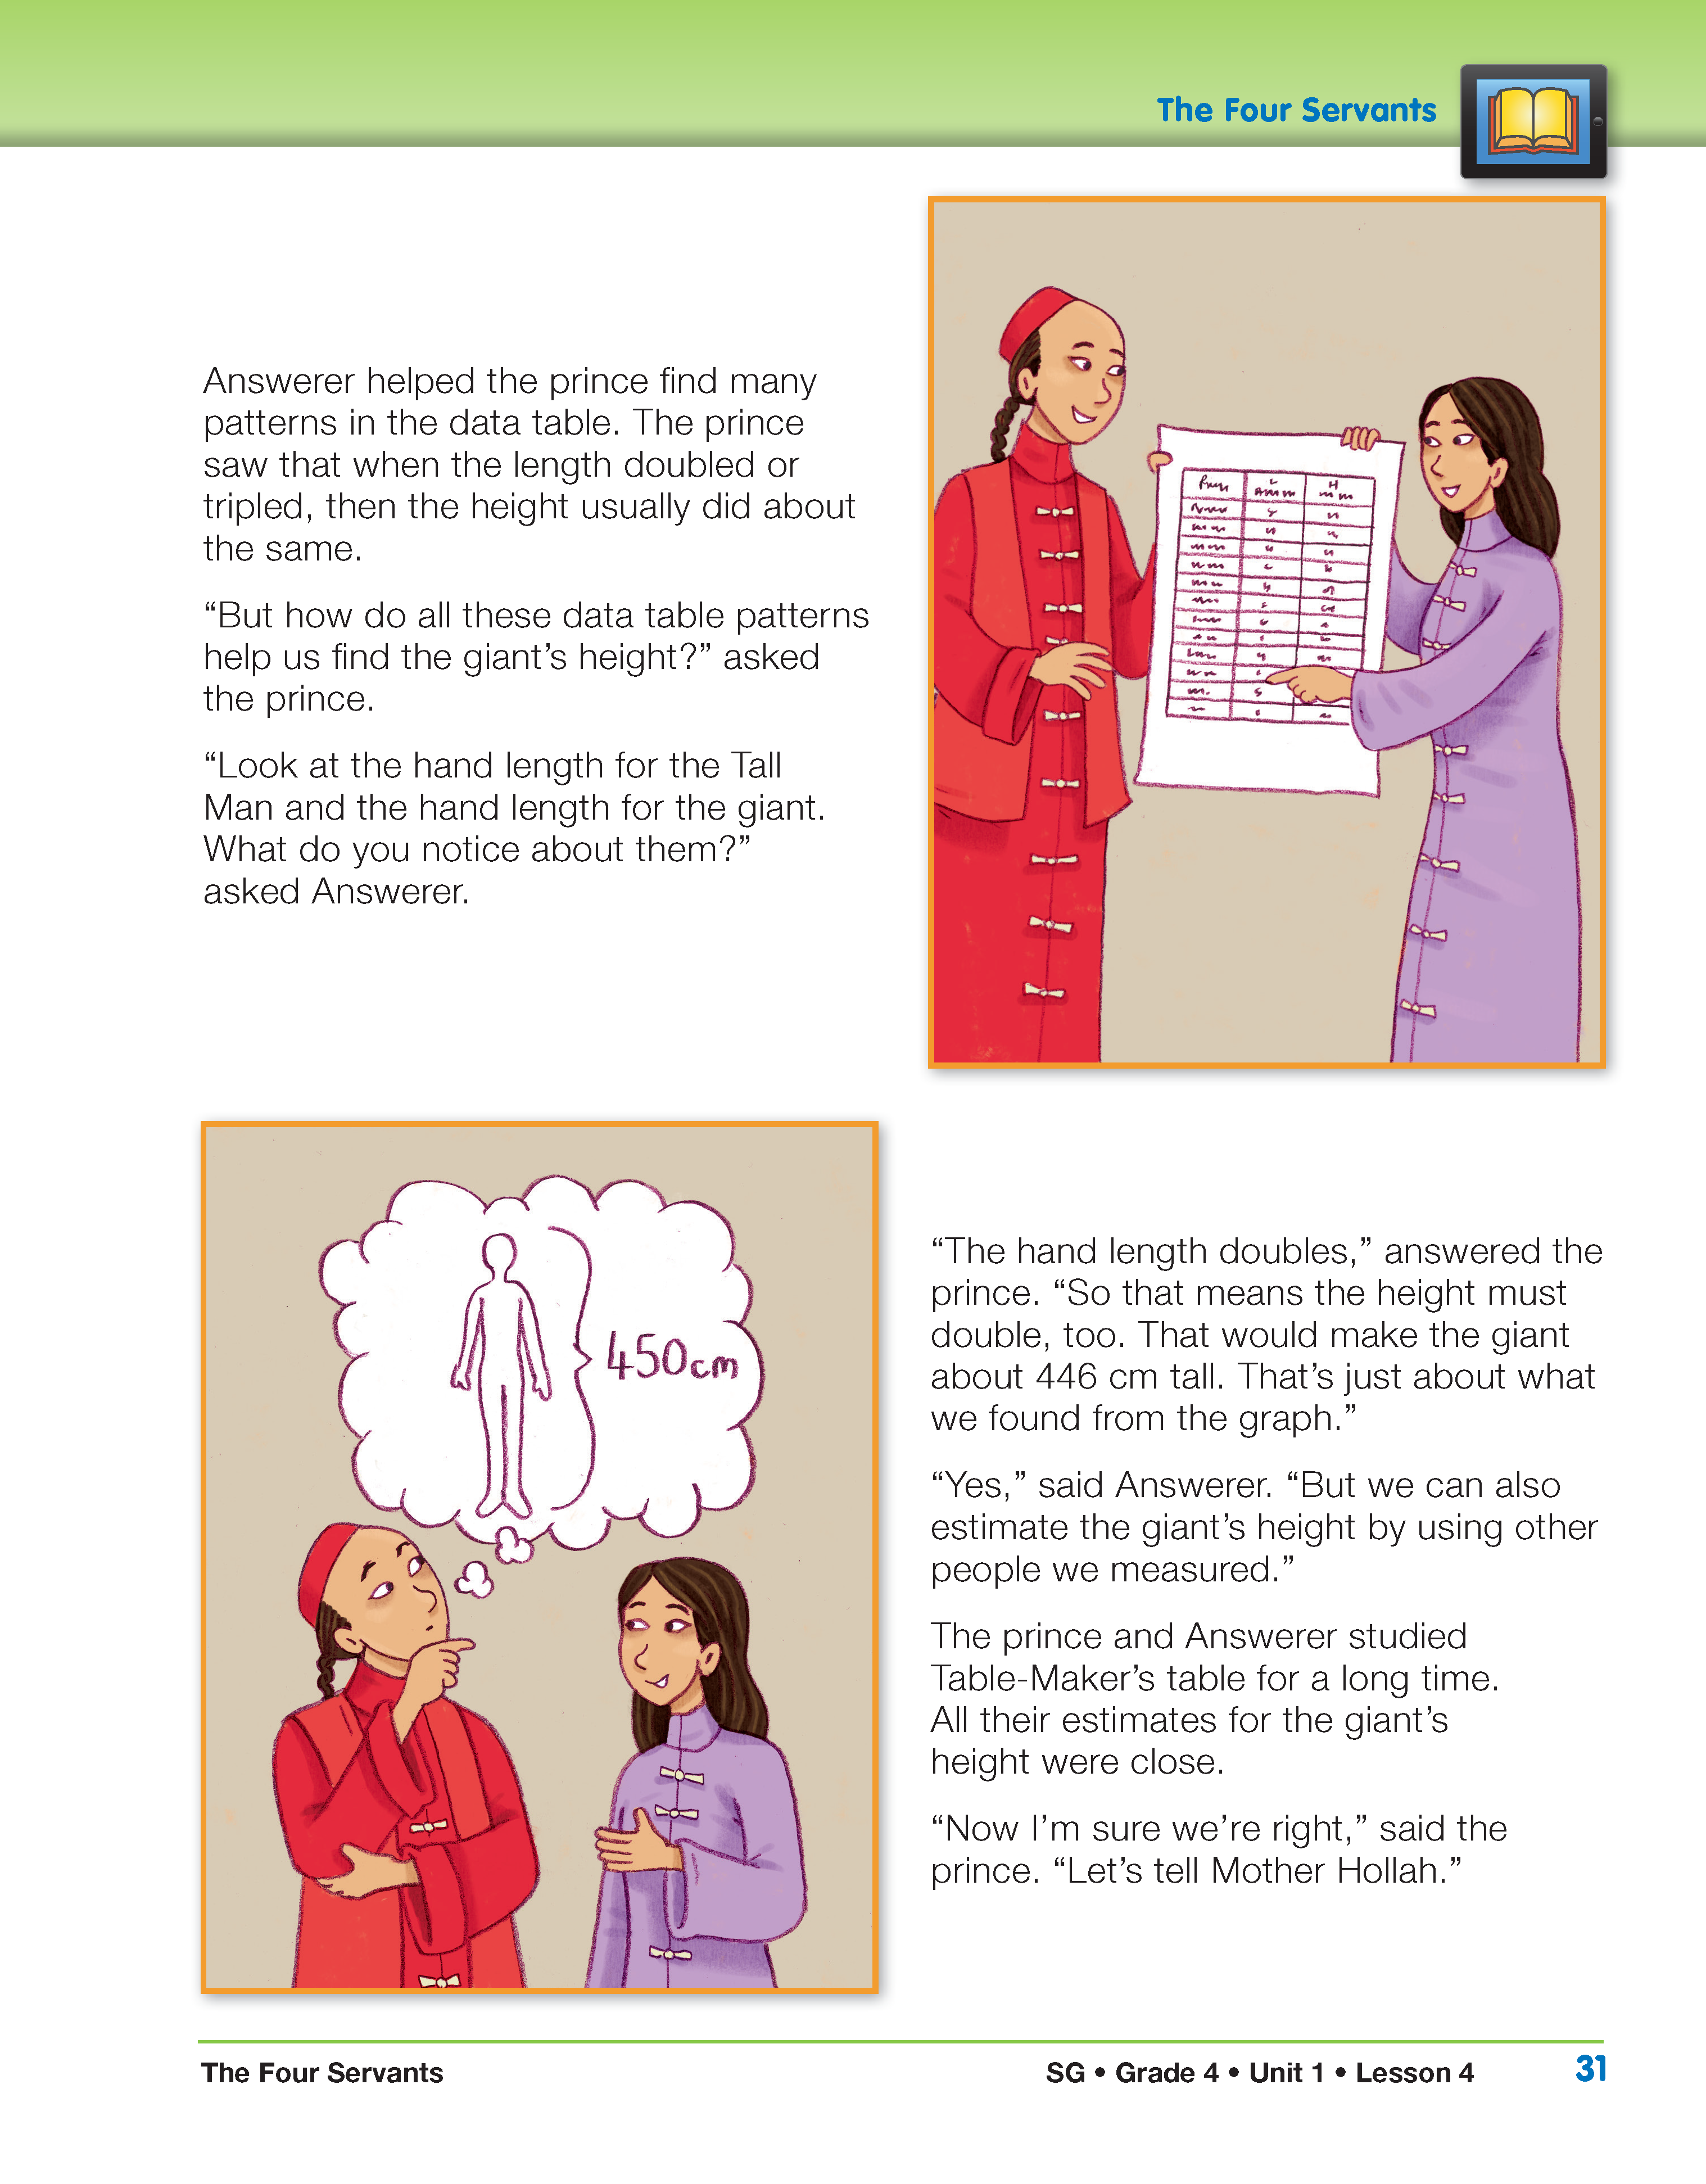
- Did the prince and his servants find the exact height of the giant? Was their answer close enough? Why do you say so? (Using the graph, the prince predicted that the giant would be about 450 cm tall, and using the patterns of doubling in the data table, he predicted that the giant would be 446 cm. These estimates are very close to the giant's height of 448 cm.)


