Arm Span vs. Height
Est. Class Sessions: 4–5Developing the Lesson
Part 5. Analyzing the Data
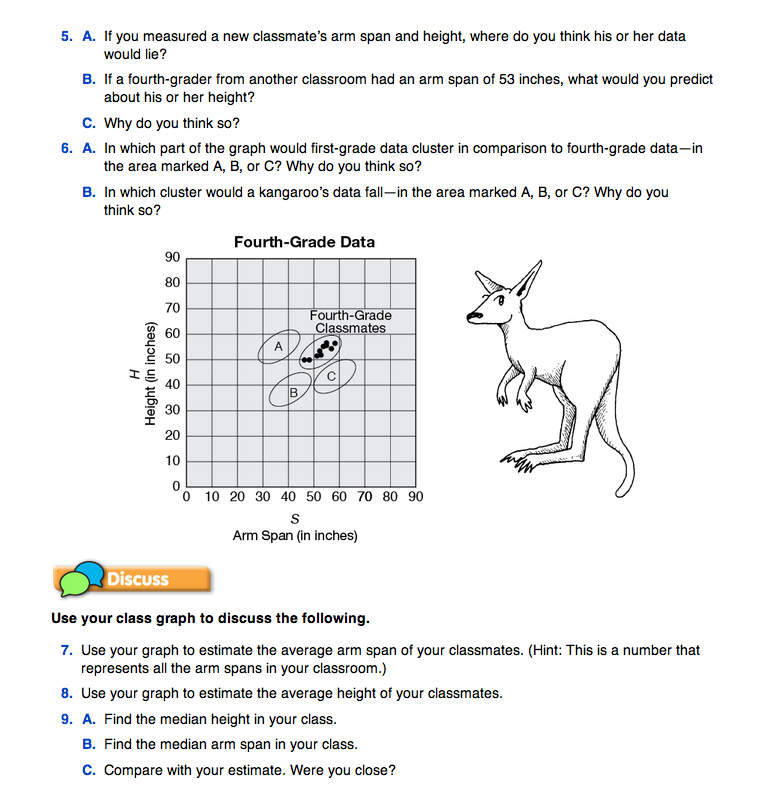
Describing the Data. Have students work in their groups to answer Questions 3–6. Ask the groups to report their answers during the class discussion. For Question 3, students may say that the data points are “clumped together” or “they form a group.” In some cases, as in Figure 4, a student might even say the data points “run diagonally.”
Question 5B asks students to make a prediction about another fourth-grader's height, given his or her arm span. Although we cannot predict precisely where a person's data point will lie, we do know with certainty that it will fall within the cluster. By referring to the data table and graph, students should recognize that the height of a student and his or her arm span are usually within two inches or so of one another. Discuss the range of arm spans and the range of heights in your class. A new fourth-grader's measurements will probably fall somewhere within these ranges.
Encourage students to give their answers with units. Students should have labeled their graphs with units of measurement, so their answers should also include units.
Predictions and Generalizations. Verify students' understanding of the data displayed on the graph by discussing circumstances where arm spans and heights may not be approximately equivalent. For example, in Question 6B, students find where a kangaroo might fall on their graph. Kangaroos have significantly shorter arm spans than heights. Therefore, the data for kangaroos would fall above and to the left of the fourth-grader data. You might also discuss where data would fall for snakes and basketball players.
Ask:
If you assign Questions 7–10 for group discussion, make sure students have the class graph and data table available.
Questions 7–10 involve estimating and finding medians. A point in the center of the clump is representative of a student with the average arm span and height for the class. Use the class data table and graph to estimate the average arm span and height. Refer again to Figure 4.
Question 9A asks students to find the median height. Remind students that to do so they must first rank the heights.
Ask:
Write those two numbers at opposite ends of the board or on a display. Then, as in Lesson 3, have the rest of the students write their heights on a sheet of paper and line up in order. As they are ranking themselves, have a student write the heights in order on the board or display. Remind the student to enter a height for each student; i.e., if two students have the same height, that number should be written twice.
Ask students to find the median, the middle value. If you have an even number of students, ask the two middle students to determine what number is midway between them and name the median. Have two students find the median value on the board or display.
You can repeat the same exercise to find the median arm span of your class, having students write their arm spans on a sheet of paper and line up in order. Or you could have your students write their arm span values on the board or display in order. In either case, have a student demonstrate finding the middle value, or median.
Complete the discussion using Question 9C and Question 10. These questions prompt students to compare the estimates for the median arm span and height they made using the graph to the medians they found lining up as a class and using all the values.


