Getting to Know Room 204 a Little Better
Est. Class Sessions: 2Developing the Lesson
Part 2: Collecting, Organizing, and Graphing the Data
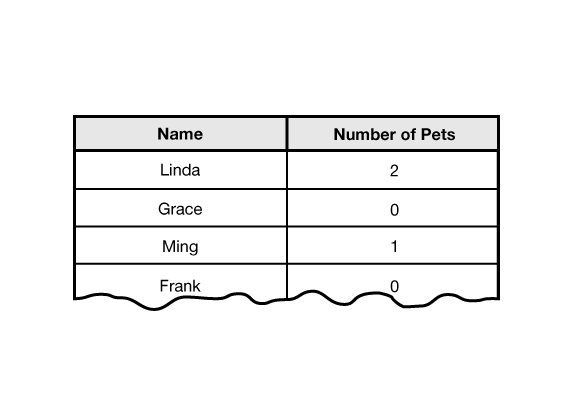
Collect and Organize Data. Before collecting the raw data on the variable your class has chosen, create a class data table on large paper or several displays of the Three-Column Data Table. In the first column, list students' names. In the heading of the second column, list the name of the variable you are studying. Then, record each student's individual data beside his or her name. See Figure 1 for an example of raw data.
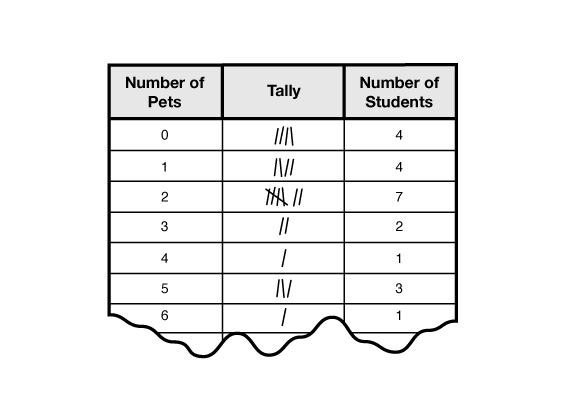
Next, your class needs to organize the data by creating a new table like that in Figure 2. Make another three-column data table. Label the three headings as follows: the name of the variable you are studying, Tally, and Number of Students.
Ask a volunteer to list all of the values that appeared in your raw data table in numerical order in the first column. Then, using the raw data, have students tally the number of students that have the same value for the variable. Once all the data has been tallied, the marks are counted and the total for each row is recorded in the third column. The total number of all of the tally marks should equal the number of students in the class. The organized data can then be graphed.
Improve the Graphs. Before students begin to draw their graphs, use displays of the Bar Graphs I and II: How Would You Improve It? Masters to continue the class discussion from Lesson 1 about correct and effective graph making. These masters show bar graphs of the Room 204 data but do not organize the data as well as they could.
Ask students these questions after they study Bar Graph I:
Ask students these questions after they study Bar Graph II:
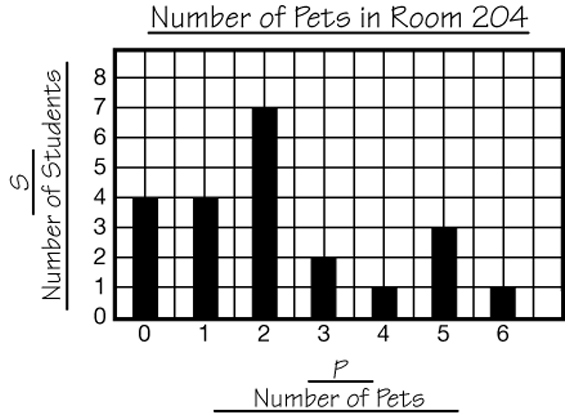
Graph Your Data. Use a display of Centimeter Graph Paper to demonstrate setting up a bar graph as shown in Figure 3. Be sure to discuss the following before students create their own graphs: giving the graph a title, labeling and scaling axes, and drawing the bars. Discuss which variable will go on the horizontal axis.
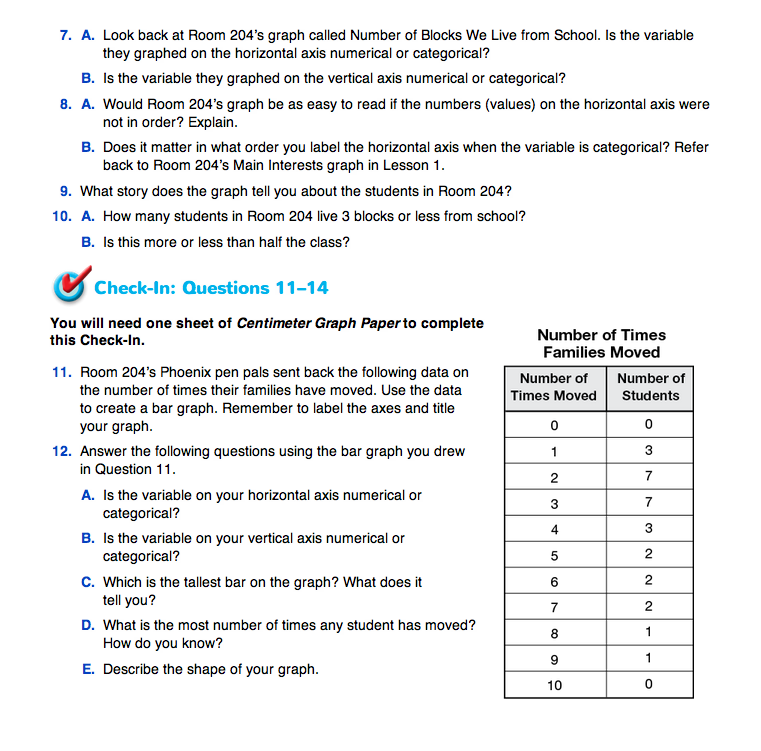
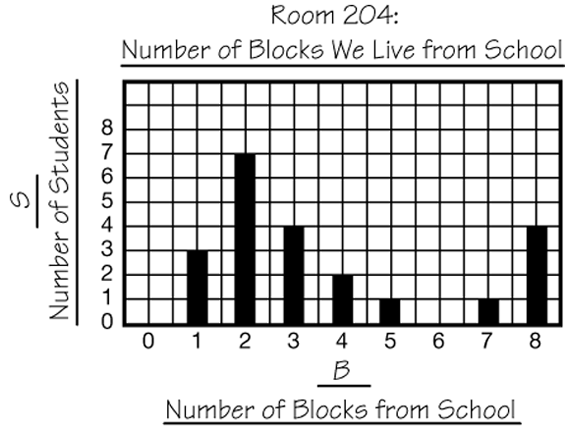
Ask students to look back at Room 204's graph in the Student Guide.
Students are now ready to graph the data they have collected. While students graph the data on Centimeter Graph Paper, have one student create a class graph of the data to display for the class. This class graph will serve as a reference for class discussion.
Read Graphs to Find Information. Use Questions 3–6 to start a discussion about what you have learned about your class.
Questions 7–10 ask similar questions about Room 204's data. Question 8 asks about the reasonability of the graph when the numbers (numerical values) are not in order. The shape of Room 204's graph in the Student Guide tells us more when the numbers are in order. Question 9 helps students recognize the graph's story. See Figure 4. The story that the tall bars at the beginning of the graph tell us is that the majority of the students in Room 204 live near school—3 blocks or closer. The short bars in the middle tell us that not as many students live between 5 and 7 blocks away. Then, the final bar shows that several students live quite far. These students might get to school by bus.


