Lesson 3

An Average Activity

Est. Class Sessions: 2

Developing the Lesson

Part 2: Exploring Medians Using Data About Room 204

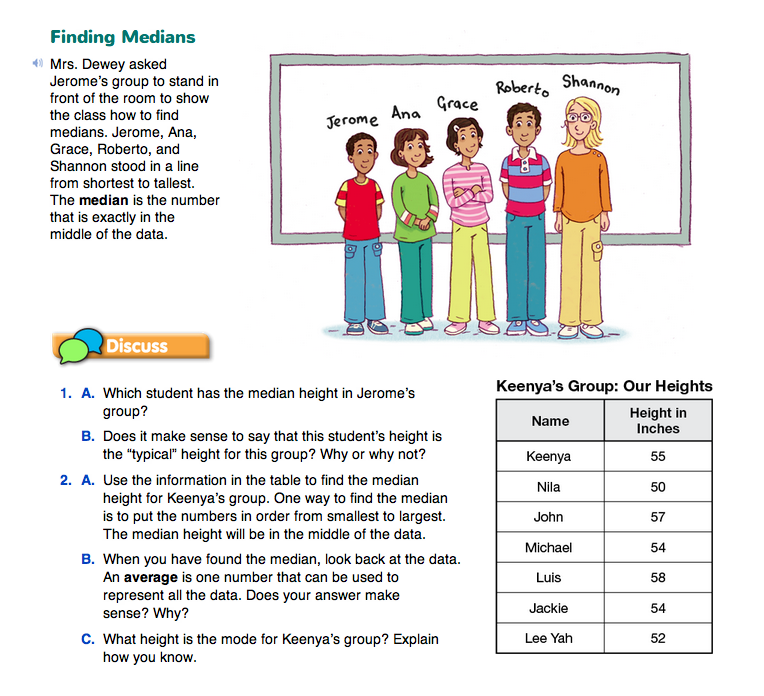
The concept of average is described briefly on the An Average Activity opening page in the Student Guide. Have students answer Questions 1–6 with a partner to review procedures for finding the median and explore the uses of averages in describing a set of data.

Discuss Questions 1–6. In Question 1A, students identify the child with the median height. Grace has the median height because she is standing in the middle of the line. Question 1B asks about the idea that the middle height is a typical height for the group.

  • Which height would represent the heights of the group better?
  • If you can choose just one height of the group to represent the heights of all the students in the group, which height would you choose?
  • Why would you choose that height?

Students' reasons for choosing a representative height that is not the median may vary. For example, they may think the most typical height in this data set should represent all fourth-graders. In this case, it is important to remind students that the most typical height should represent only the sample (fourth-graders in this class), not an entire population (all fourth-graders).

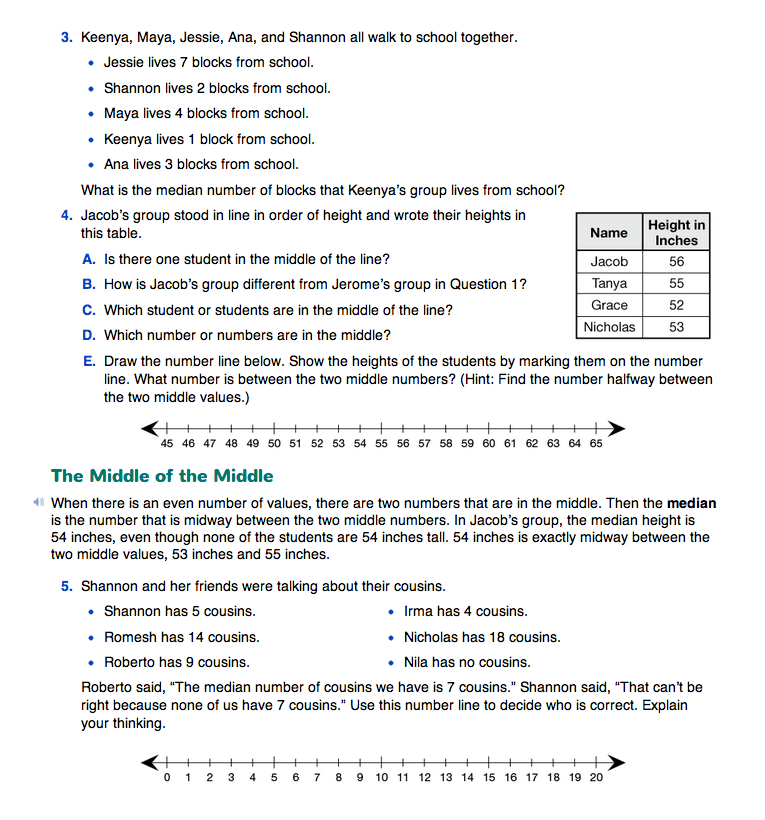
Questions 2–6 provide practice finding the median. Note the difference in finding a median for an odd number of values and an even number of values. With an odd number of values, the median is the middle value. With an even number of values, there is no one middle value, so the median is a number exactly midway between the two middle values.

Allow several students to share their methods. If students arrive at different answers from each other because of errors or misconceptions,

  • Can anyone tell why these answers are different from each other?
  • How do you think each student arrived at his or her answer?
  • Can you see an error?

Help students explain their answers and explore their own possible misconceptions using prompts similar to those in the sample dialog.

Teacher: Who would like to explain his or her answer to Question 5?

Jackie: I will! The median was nine cousins.

Teacher: Can you tell us how you decided it was nine cousins?

Jackie: Well, the smallest number is 0 and the biggest is 18, so I just cut 18 in half. That is 9, so 9 is right in the middle. Nine is the median.

Teacher: Thanks, Jackie, that is an interesting strategy. Who else has an answer or a different strategy?

Romesh: I don't think Jackie is right. Just because 9 is in the middle between 0 and 18, it doesn't mean that it's the median.

Teacher: Why not, Romesh? Isn't that what the median is? The middle value?

Romesh: But I thought you had to use the numbers that you have.

Teacher: What do you mean?

Romesh: Well, you have to line up all the numbers you have and then find the middle one. Jackie didn't do that. She just used two numbers, 0 and 18.

Teacher: How would you find the median, Romesh?

[Romesh shows how he re-wrote all the numbers of cousins in order, and then located the middle values, 5 and 9.]

Romesh: These are the two that are in the middle. See, there are 2 numbers bigger and 2 numbers smaller.

Teacher: What do you do now?

Romesh: I have to find the number that is right in the middle of these two. That is 7.

Asking students to critique each other's reasoning can be a sensitive issue, but it is an important process for building a community of learners. Remind students that the classroom is a safe place to make mistakes because some of the best learning happens when mistakes are made. Students might also need a reminder early in the year that critiquing should always be done respectfully.

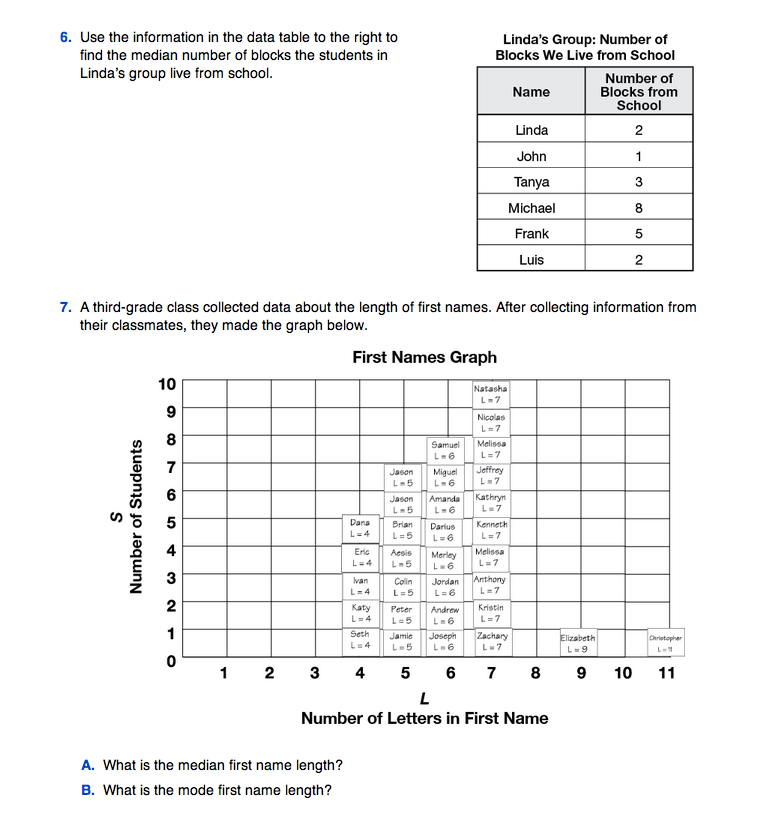
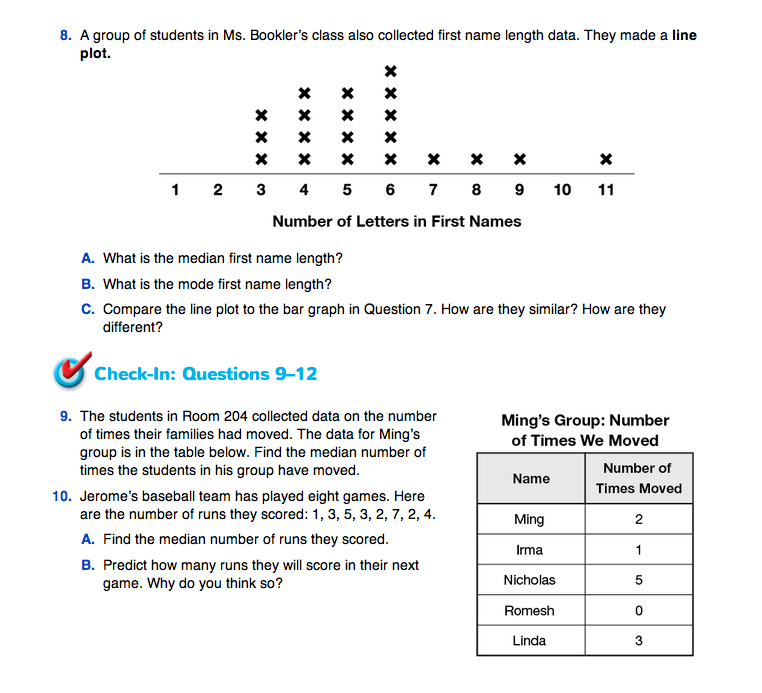
Ask pairs to work on Questions 7–8. Students revisit data they analyzed in Grade 3 Unit 1 First Names. The data is represented in a graph rather than a data table or list in these questions. Ask students to share their strategies for finding the median (middle) and the mode (most common) first name length. One strategy is to eliminate the data on extremes until the median is found.

Working in pairs at the beginning of the year is a good way for students to start working in small groups. To encourage pairs to work together, tell students that you will answer only team questions. That is, you will not answer an individual's question unless he or she has discussed the question with a partner. If both partners agree that they cannot answer the question, then both students should raise their hands to let you know that they have both considered the question and that they still need your help.

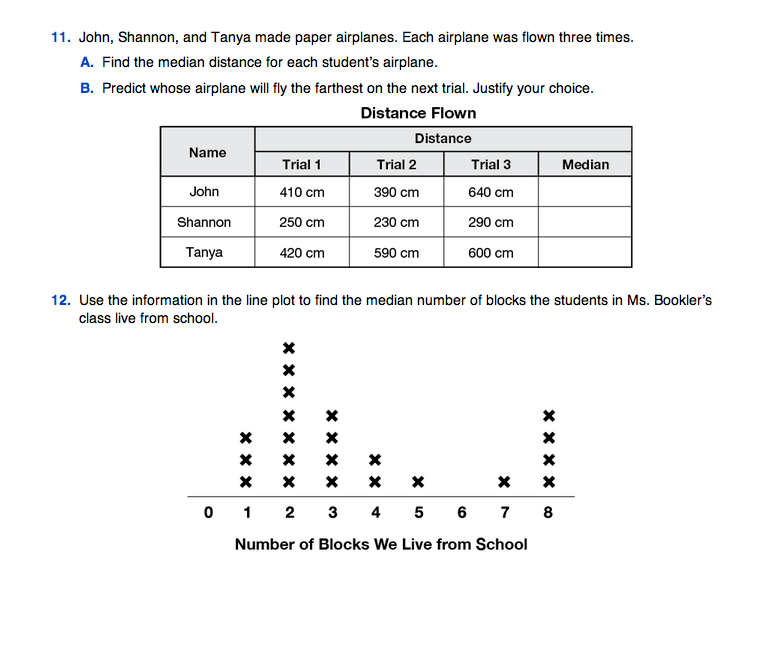
Line Plot. A line plot is a graph that shows the frequency of data along a number line. Line plots are best for small data sets, less than 30 data points. Line plots are also very similar to bar graphs. Bar graphs include a scaled vertical axis that line plots do not. Each “x” on a line plot represents one piece of data instead. Line plots are quick and simple representations of data used to show the distribution of data and are used to find measures of central tendency like median and mode.

Assign Check-In: Questions 9–12 in the Student Guide.

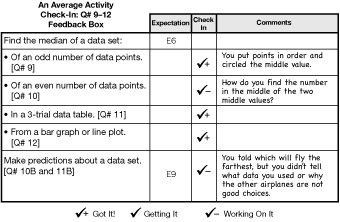
Use Check-In: Questions 9–12 and the corresponding Feedback Box to assess whether students can find the median of a data set [E6] and can use a median value of a data set to make a prediction [E9].


Figure 1: Sample Feedback Box for Check-In: Questions 9–12

The Workshop in Lesson 6 provides targeted practice with finding the median [E6] and making predictions [E9].

X
SG_Mini
+
X
SG_Mini
+
X
SG_Mini
+
X
SG_Mini
+
X
SG_Mini
+