Lesson 5

Arm Span vs. Height

Est. Class Sessions: 4–5

Daily Practice and Problems

Teacher Notes
X

TIMS Task

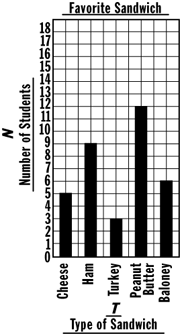
Ask students to graph the data in a bar graph. You may wish to use this item as an assessment.

  1. 5, 9, 3, 12, 6
  2. 35 students
  3. Peanut Butter

Ongoing Assessment

Use DPP item T to assess making a bar graph using categorical data [E3].

T. Favorite Sandwiches

Students in one class were asked to name their favorite sandwich. The following data was collected.
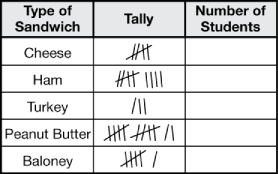
  1. Complete the third column of the table.
  2. How many students are in the class?
  3. Which sandwich was the favorite of the greatest number of students?
  4. Make a bar graph of the data. Don't forget the labels and a title.