


Introduce Base-Ten Pieces
Est. Class Sessions: 3–4Developing the Lesson
Part 1: Grouping and Counting Bits

Base-Ten Pieces. We refer to the pieces as flats,
skinnies, and bits to give teachers an easy way during
discussion to distinguish between the manipulatives themselves
and the quantities they represent. This terminology is also
useful in later grades when we change the value each piece
represents. For example, when discussing decimals, a flat may
represent one whole and the bit  or 0.01. In Second Grade
this is not an issue—so if you find it simpler for the
students, you can substitute "hundreds," "tens," and "ones" as
you refer to the pieces. Note, however, that the student pages
use flats, skinnies, and bits.
or 0.01. In Second Grade
this is not an issue—so if you find it simpler for the
students, you can substitute "hundreds," "tens," and "ones" as
you refer to the pieces. Note, however, that the student pages
use flats, skinnies, and bits.
Estimate Bits in the Collection. Show students the collection of base-ten pieces that are one cubic centimeter. Tell them these are counters, like the connecting cubes, except they are smaller and cannot be attached to each other. We call them bits. You may want to discuss with students whether they have seen or used them before.
Tell the class they are going to count them, just like they counted the connecting cubes. First, however, they will estimate how many bits are in the whole collection. Show the referent bags of ten bits and one hundred bits and the referent bags of ten connecting cubes and one hundred connecting cubes you prepared prior to the lesson. See Materials Preparation.
Ask students to consider the relative size when making their estimates:
Show the intervals chart you prepared and tell students that the total number of bits will be between the smallest number listed and the largest. Have each student write his or her own estimate for the total number of bits on a self-adhesive note, along with his or her name. When all the students have written their estimates, ask them to place their estimate below the appropriate interval on the chart.
As students place their notes, ask:
If students have trouble finding the correct interval or explaining where to place their estimates, encourage them to think about and use place value concepts they learned in Unit 5. For example, ask how many hundreds are in their estimates.

After all the estimates are displayed on the Interval Chart, ask students to consider the range of estimates:
Estimate Small Group of Bits. Distribute the collection of bits among the student pairs. Give each pair about 30 to 50 bits and a second self-adhesive note. Before they start counting, ask each student pair to estimate how many bits they have received. However, they are to write their estimates as groups of ten and leftovers. Show the referent bags of 10 bits and 100 bits again. Ask students whether they think their small group from the collection of bits falls between 10 and 100 (between one group of ten and ten groups of ten).
Ask:
Ask the same question with a few different numbers. Then have students write the estimates for their part of the collection of bits using groups of ten and leftovers on their self-adhesive note. See Figure 3.
Group and Count Small Group of Bits. Students then count their bits, grouping into tens and leftovers. As they are doing so, circulate about the room and ask about their groupings
Ask:
After a few minutes, start showing a skinny to student pairs and eventually to the class as a whole.
Ask:
Show students the "Bank" of skinnies you prepared. Circulate among the student groups trading bits for a skinny. Take away ten bits as you give them a skinny. Ask students to compare the skinnies with the bits. Students may recognize that the skinny is the same size as ten bits. Guide students to the notion that a skinny can be used like the stack of ten connecting cubes. It is like ten bits all fused together.
Ask:
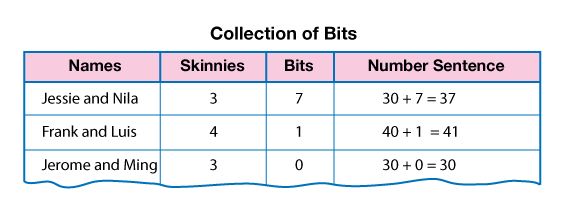
Group and Count Bits in Collection. Students now need to find the total number of bits in the collection of bits. Ask each pair to record the skinnies and bits they counted on a display of the Collection of Bits Master. See Figure 4.
Organize students into three groups: one group to count the skinnies, one group to count the bits, and a group that will use the information on the Collection of Bits chart to determine the number of bits in the class collection. Choose two students to manage the "Skinnies Bank" as you did earlier. These students will collect 10 bits from students and trade them for 1 skinny.
Ask student pairs to deliver their skinnies to the group that will be counting the skinnies and to deliver their bits to the group counting the bits. Ask the students managing the "Skinnies Bank" to stand near these groups. Make calculators available to the students using the Collection of Bits chart. These students can use whatever strategy they choose to find the total number of bits in the collection (e.g., add up the counts, add to find the number of skinnies and bits and then trade to find the number of bits).
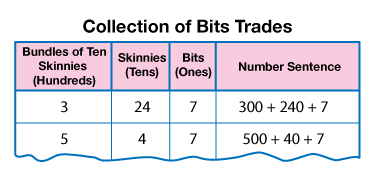
As students are counting, draw the chart shown in Figure 5. This chart will be used to summarize and find the number of bits in the entire collection.
As you collect and record the counts from each group ask:
You should have a count for the number of bundles of ten skinnies, two counts for the number of skinnies, and the number of bits. There should be skinnies left over from grouping bundles of ten skinnies and a number of skinnies counted when the group organized the bits. For example, the group organizing the bits traded bits for 18 skinnies and the group making bundles of ten skinnies had 6 leftover skinnies, for a total of 24 skinnies. Continue to organize skinnies into bundles of ten until all possible trades have been made. See Figure 5.
Compare Counts to Estimate. Direct students' attention to the Interval Chart.
Ask:
Write the number on a larger or different-colored self-adhesive note so that it is easily distinguishable. Ask a student to post it in the correct interval on the chart. Have students discuss where the total fits relative to the estimates posted.
Ask:
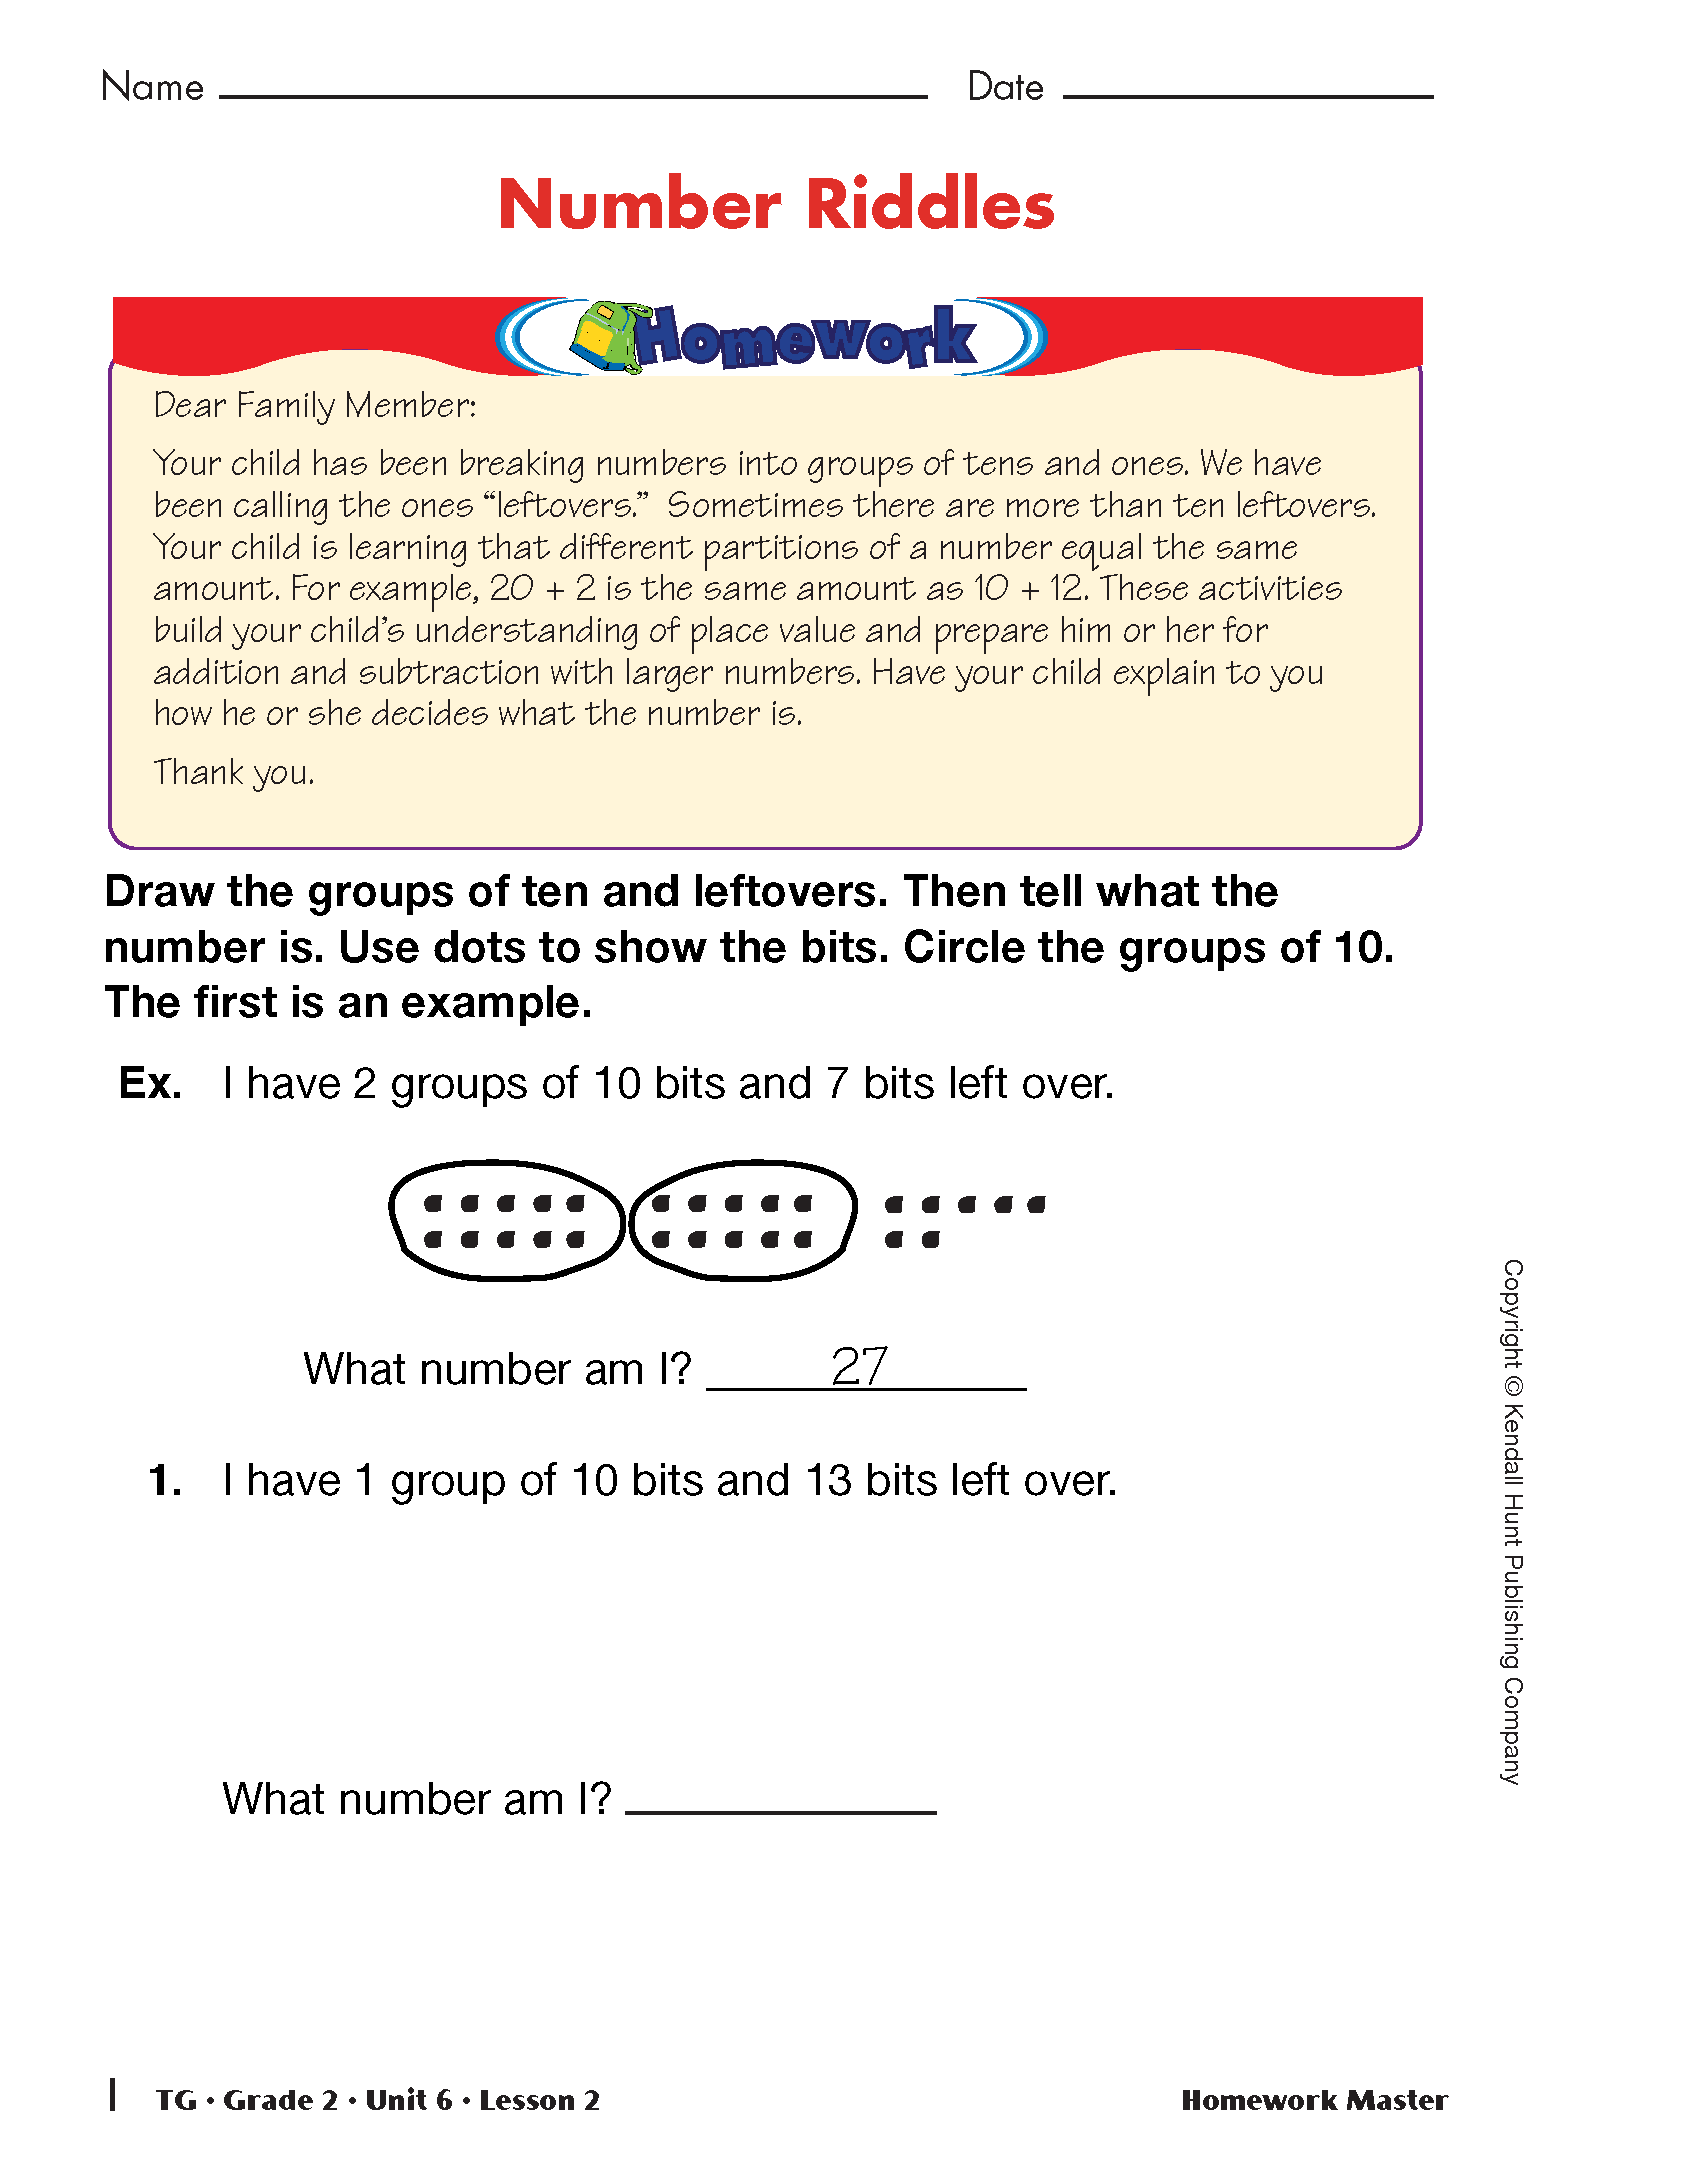
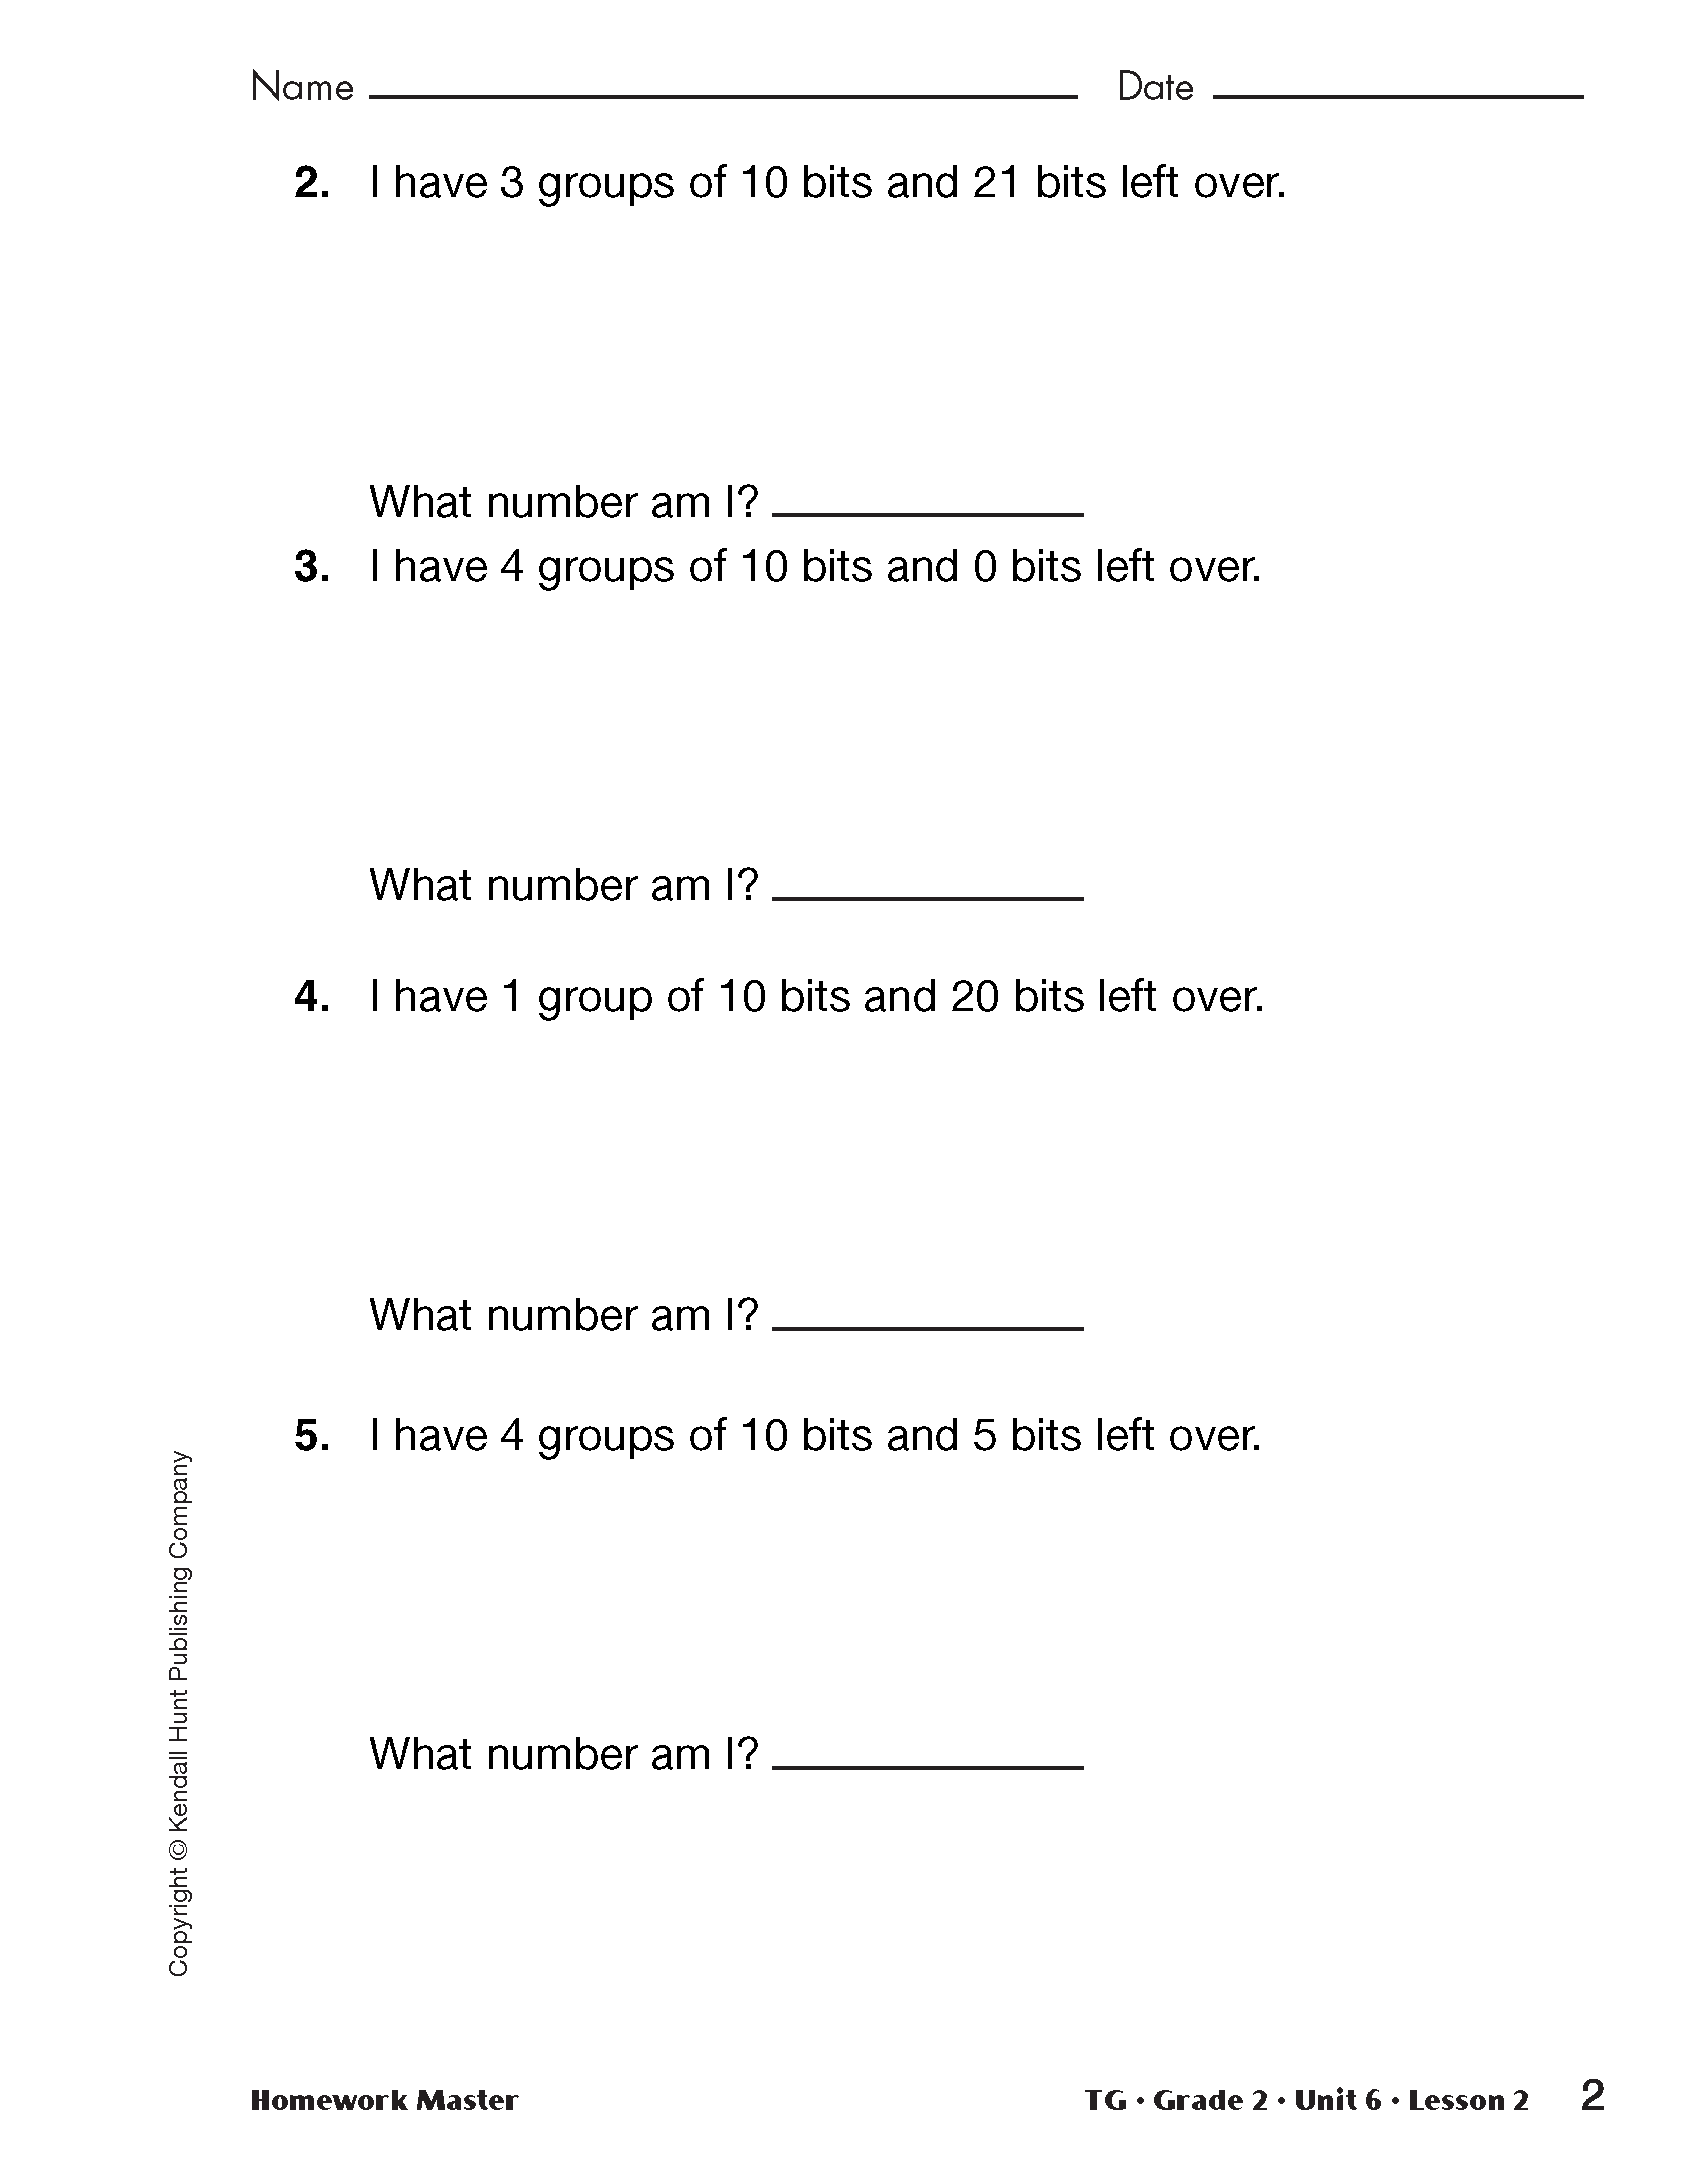
Assign the Number Riddles Homework Masters.