Volume vs. Number
Est. Class Sessions: 3–4Developing the Lesson
Part 2. Conduct the Experiment
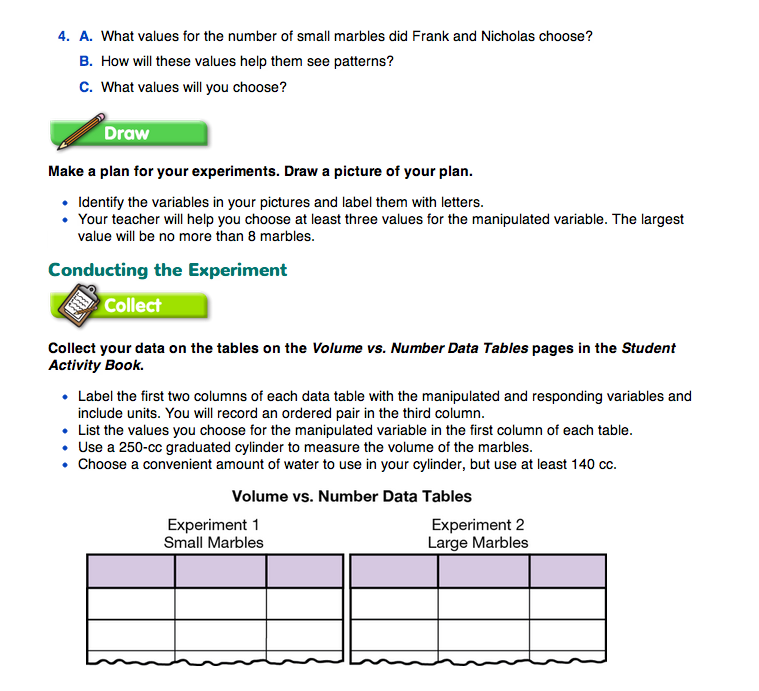
Collect the Data. Refer students to their drawing and the Volume vs. Number Data Tables page from their Student Activity Book. Ask students to use the information in their drawings to label the tables. See Figure 2.
Students should use a 250 cc graduated cylinder for both experiments and choose a convenient amount of water. A good choice is 140 cc.
Figure 2 shows sample data for small (standard size) marbles in Experiment 1 and large (3/4-inch) spheres in Experiment 2.


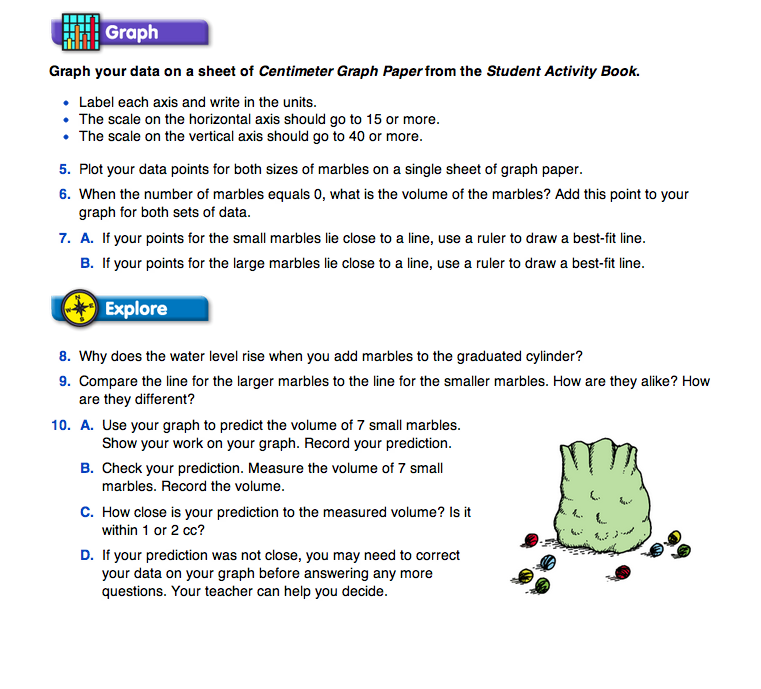
Graph the Data. Students graph the data from both experiments on a single copy of the Centimeter Graph Paper Master from the Teacher Guide. In addition to the points in the data table, they should add a point at (0, 0) since the volume of 0 marbles is 0 cc (Question 6).
Question 7 instructs students to draw best-fit lines through each set of data points.
The graph for this experiment is very similar to the graphs students drew for Bouncing Ball in Unit 5 and Downhill Racer in Unit 10. They should be ready to make their graphs with very little assistance from you. If you use marbles that are larger than 3/4-inch in diameter, your students may need to use a different scale on the vertical axis.
As students work, check for appropriate scales, labels, and titles. Look also for points that have been plotted correctly and lines that “fit” the points. Figure 3 is a graph of the sample data in Figure 2.