Volume vs. Number
Est. Class Sessions: 3–4Developing the Lesson
Part 3. Explore the Data
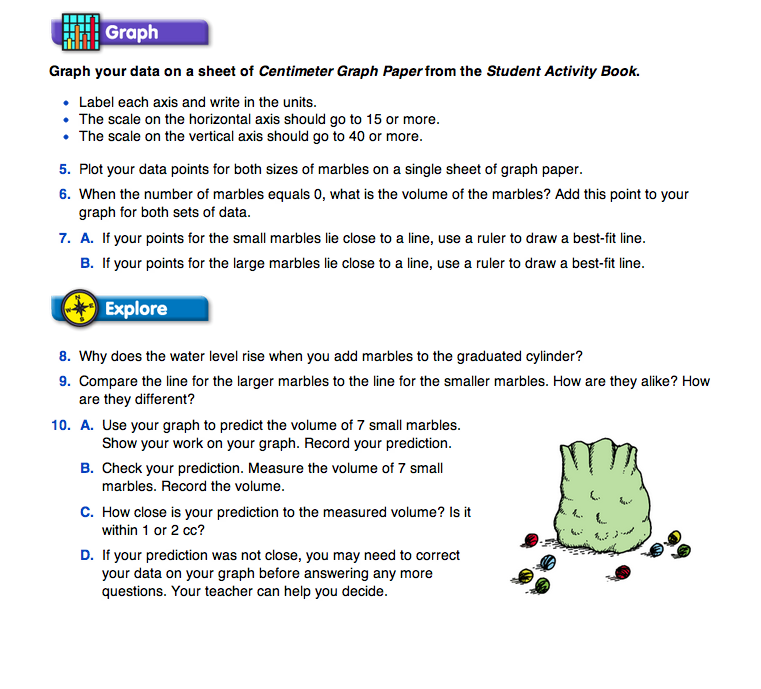
Make Predictions from Tables and Graphs. The questions ask students to make predictions and generalizations based on data. Have students begin by completing Questions 8–11 with partners. Question 10 asks students to use their graphs to predict the volume of seven small marbles and then to check their predictions. Tell students that for Question 10, their estimates should be within 1 or 2 cc. If a group finds that their estimate for Question 10 is not within 1 or 2 cc, they may need to check their data or correct their graph before continuing with the rest of the questions. The dotted lines on the graph in Figure 3 show solutions to Questions 10 and 11 using the data from the tables in Figure 2.
Explore Relationships Between Variables. Question 12 asks students to use their data to explore the relationship between the variables. (See the Content Note.) Have students discuss the questions with their partners and then discuss them with the class. For Question 12A, encourage students to look both across the rows as well as down the columns and to use precise language to describe the patterns. Looking across the rows in the data table in Figure 2, we can see that the Volume (V) in the second column is not quite two times the Number of the Marbles (N). This pattern is repeated in the ordered pairs (N, V). In each ordered pair, V is a little less than twice N.
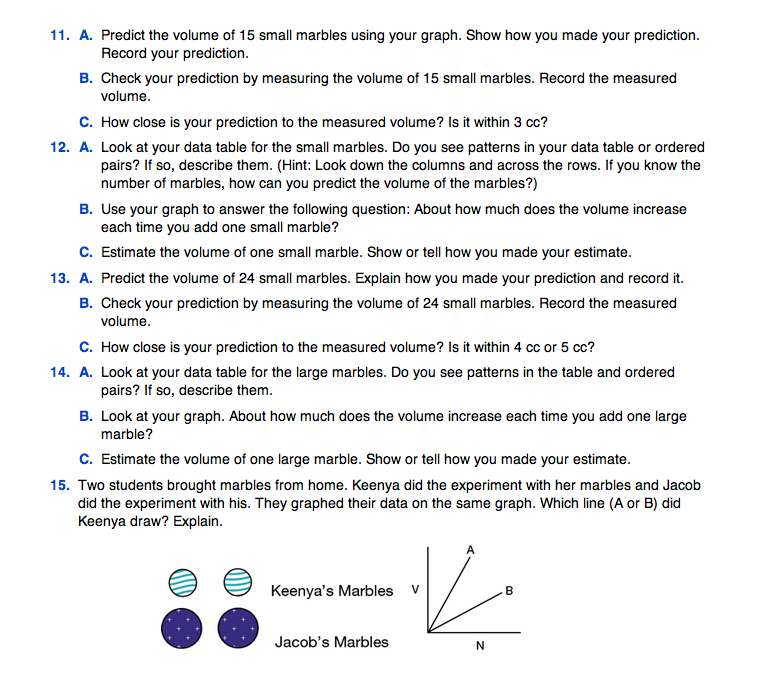
Question 12B, “About how much does the volume increase each time you add a marble?” can be answered by looking at the graph. On the graph, adding a marble is the same as moving one unit to the right. When you move one unit to the right, the volume on the vertical axis increases about 2 cc. Using this information, students can estimate that the volume of one marble is a little less than 2 cc (Question 12C).
Students' strategies will vary for Question 13. Students can predict the volume of 24 marbles using their estimates for one marble from Question 12C. That is, 24 marbles × 2 cc = 48 cc, so a prediction that the total volume will be less than 48 cc is reasonable. Students may also choose to use the graph and find the volume of 12 marbles to be 22 cc (as in Figure 3) and then double the volume to make a prediction of 44 cc. Encourage students to find more than one way to solve the problem.
Question 14 asks the same questions for the large marbles that Question 12 asked for the small marbles. Answers will vary based on the size of the marbles you use. For the large marbles, the patterns in the data tables in Figure 2 (Question 14A) and the change in volume for one marble may be more difficult to see on the graph (Question 14B). Encourage students to make connections between the data tables and the graph and use the information from both representations to make their estimates for one marble in Question 14C. Using the data in Figures 2 and 3, the volume of one marble is about 3.5 cc or between 3 and 4 cc.
Question 15 asks students to apply these concepts to a new situation. Ask students to answer the question and to work with their partners to craft a clear explanation for their choices. Keenya drew Line B because she had the smaller marble, so her line will not be as steep. Each time she added a marble the line would not go up as much as if she had added a larger marble.
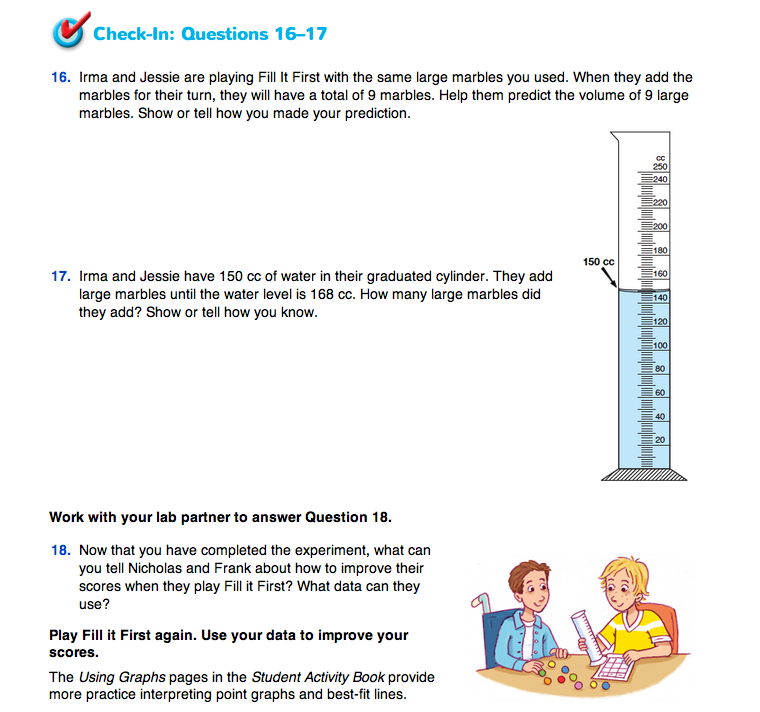
Communicate Your Thinking. Have students read Math Practices Expectations 3, 5, and 6 on the Math Practices page in the Student Guide Reference section before answering Check-In: Questions 16–17. Encourage them to think about how their written solutions will meet these three Expectations.
Ask:
As students work, continue to ask questions similar to those above.
If students are vague, ask:
Assign the Using Graphs pages in the Student Activity Book for homework.


