Sandwich Mass
Est. Class Sessions: 2–3Summarizing the Lesson
Discuss and Compare Data. Use the Discuss section in the Student Guide to summarize the lesson. Encourage students to complete Question 12 with their partners. Students can use a different color to plot their partner's data. Question 13 asks students to tell who has the bigger bite size. (By bite size, we mean mass of bite.) Encourage students to analyze their graphs to find who has the largest average bite size. Then students can compare their bite sizes found in Question 10. In general, the student with the larger bite size will have the steeper graph, since each of the larger bites will be plotted farther down on the graph. Comparing their partner's results and graph with their own should give them insights into how to complete Questions 14–16. For Question 14, students can say that the graphs are both straight lines that go downhill. Jackie's sandwich had more mass than Nicholas's to begin with. Each student took about the same size bites (the steepness of the lines are about the same), although since Jackie's line is slightly steeper, she took slightly bigger bites.
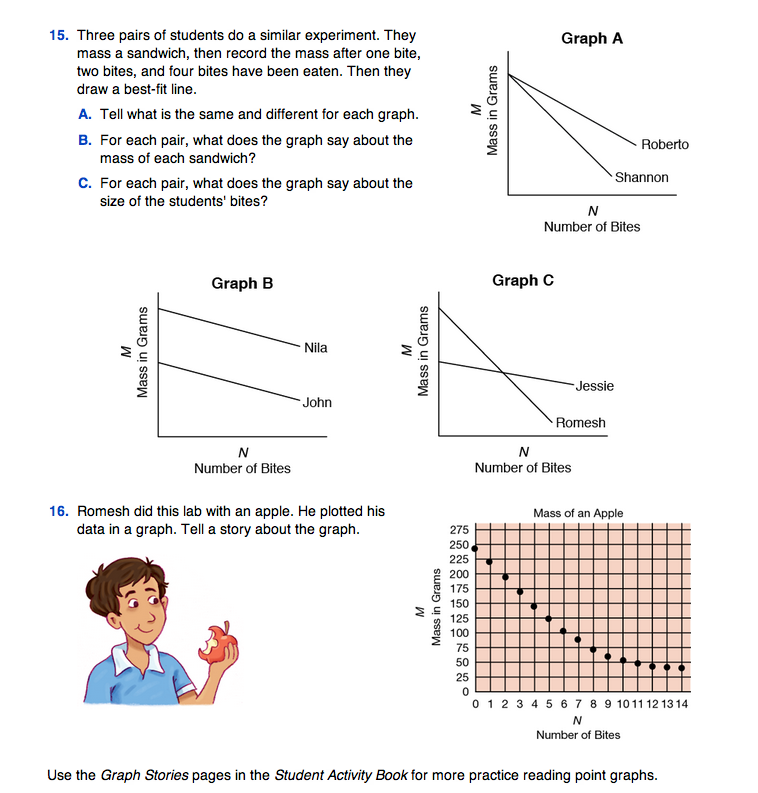
In Question 15, for Graph A, Roberto and Shannon start out with sandwiches that have the same mass (the graphs meet at the vertical axis at the same place), but Shannon takes larger bites (her line is steeper). In Graph B, Nila and John start out with sandwiches with different masses, but they take the same-sized bites (the steepness of their lines is the same). In Graph C, Romesh began with a larger sandwich and he takes larger bites (his graph crosses the vertical axis higher than Jessie's and his line is steeper).
Question 16 provides a lead-in to an extension for this lab. Romesh completed Sandwich Mass with an apple instead of a sandwich and got a graph with a different shape. He found that his bites were large at the start, but they got smaller as he neared the core. Since the size of the bites was not constant, his graph is a curve, not a straight line. And he never finished eating the apple completely, because he did not eat the core. Students can repeat the lab using an apple. Then have them compare the shape of the graph for the sandwich to the shape of the graph for the apple.
Communicate Understanding. Have students complete the Predictions Quiz Assessment Master independently. Before they begin, use the Math Practices page in the Student Guide Reference section to facilitate a discussion of how students can show or tell how they made their predictions, checked for reasonableness, and used appropriate labels.
Ask:


