Lesson 6

Sandwich Mass

Est. Class Sessions: 2–3

Developing the Lesson

Part 2. Conduct the Experiment

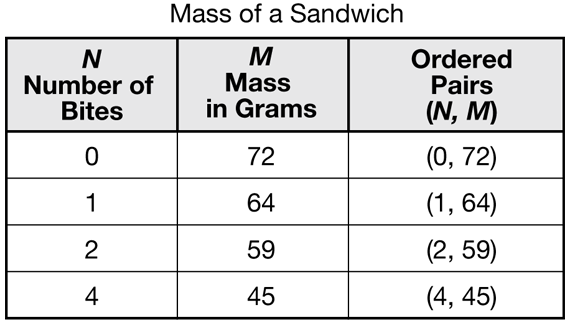
Collect the Data. Each student will have a sandwich to mass, so pairs will have to complete the data collection twice, once for each of their sandwiches. Students will use a copy of the Three-Column Data Table Master to create a data table like Shannon's in the Student Guide. See Figure 2. Let pairs complete the lab.

As students collect the data and complete their data tables, document their abilities to measure mass to the nearest gram [E8]. Look for the following:

  • Do students zero the balance before they begin collecting data?
  • Do students look carefully to see if the bar is level to decide when to stop adding standard masses and not compare the height of the two pans?
  • Do students total the standard masses correctly?
  • Do students compare their measurements with partners to reduce measurement error?

Use the Mass Review Masters to provide targeted practice.

As students mass their sandwiches, encourage them to place a napkin down on the balance to keep the balance clean and their sandwich edible. Alternatively, they could keep their sandwich in plastic wrap or wax paper. Remind students to zero the balance with the plastic wrap or napkin. Napkins have a mass of several grams and will skew the data if they are not included in the zeroing of the balance.

Graph the Data. After completing the data table, ask students to graph their results on Centimeter Graph Paper (Question 5). Make sure that students appropriately label and scale each axis. A sample graph of the data in Figure 2 is shown in Figure 3.

Question 6 draws attention to the data point where the number of bites is zero. This point lies on the vertical axis and the ordered pair will be (0, M) where M for this point is the mass of the whole sandwich. In our example, the mass (M) of the whole sandwich is 72 grams (0, 72).

X
SG_Mini
+
A sample data table
X
+
A sample Mass of a Sandwich graph
X
+