


Square Number Patterns
Est. Class Sessions: 2Developing the Lesson

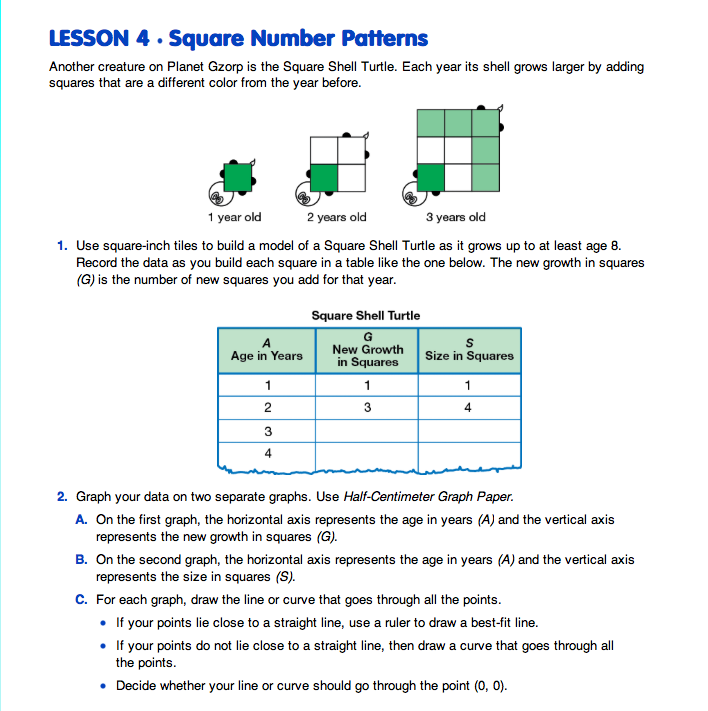
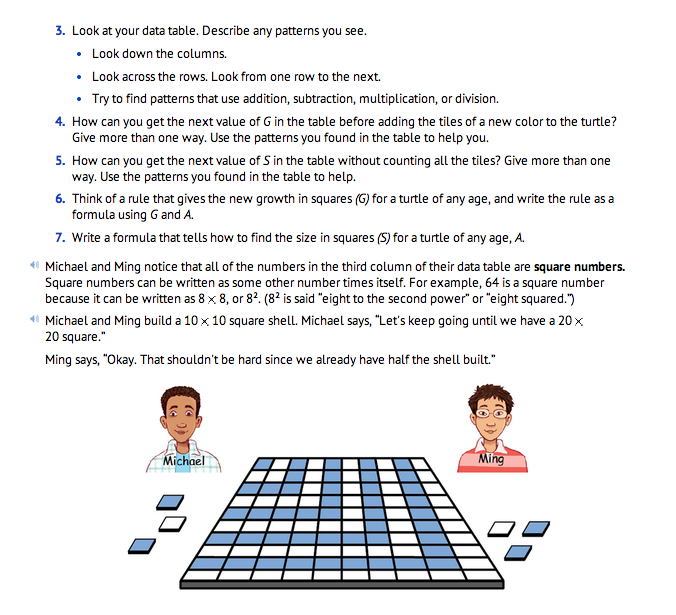
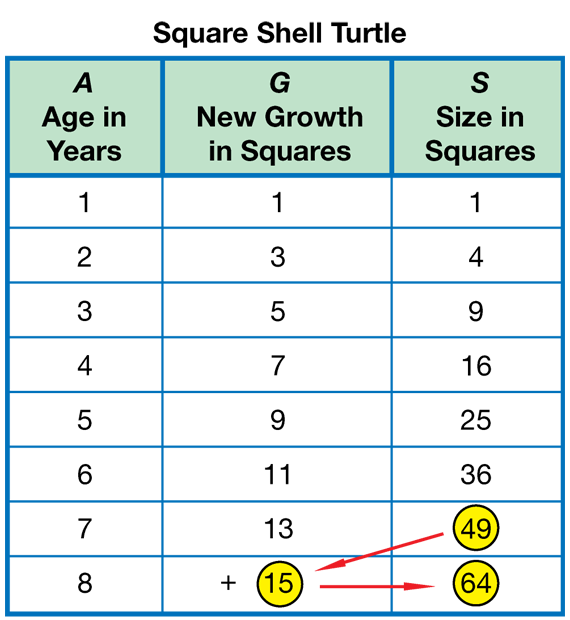
Analyze Square Shell Turtle Pattern. Read the introduction about the Square Shell Turtle on the Square Number Patterns pages in the Student Guide. Working in groups of four, students build the growth pattern as shown and described in the Student Guide. In Question 1, students record data as they add each new color to the pattern up to at least the 8th year of age. A completed data table is shown in Figure 1.
Ask student to work on Question 2 with a partner. Students will need several copies of Half-Centimeter Graph Paper. In Question 2, students draw two separate graphs on Half-Centimeter Graph Paper. For the first graph, Growth (G) vs. Age (A), the points lie on a straight line as shown in the graph in Figure 2. Students draw a line through the points. The question asks students to think about whether the line should pass through the origin.
Ask:
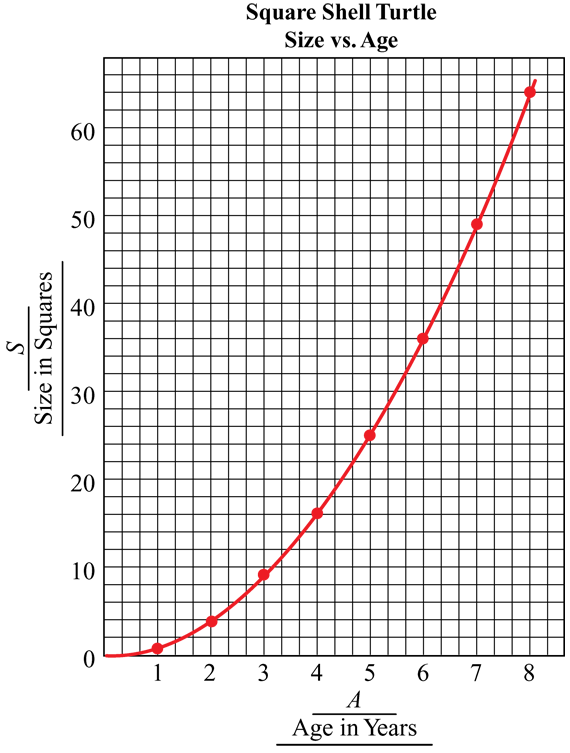
For Question 2B, students make a second graph, Size (S) vs. Age (A). The points on this graph do not lie on a straight line, making the graph different from many of the other graphs students have seen. See Figure 3. Sometimes when data points from an investigation do not fall on a straight line, we fit a best-fit line to the points, assuming that experimental error is the reason the points aren't exactly on a line. But in this activity, the numbers are exact. Students should draw a curve smoothly through all of the points as shown in Figure 3. Some students may need help doing this since there is often a tendency to “connect the dots” with smaller line segments when the points do not lie on a single straight line.
Ask:
For Question 3 students look at patterns in their data tables.
Ask:
Record student observations on a display. A list might include the following:
- The middle column is a list of odd numbers.
- The third column is a list of square numbers.
- The number in the third column (S) is the number in the first column (A) multiplied by itself (e.g., 25 = 5 × 5).
- The number in the second column (G) is 2 times the number in the first column (A) minus 1 (e.g., 9 = 2 × 5 − 1).
- If you subtract a number in the third column from the number below it, you get a number in the second column (e.g., 25 − 16 = 9).
Ask:
For Question 4, students find the next value of G (new growth in squares) before placing the next set of tiles. Have students propose different rules and post these on a display. Then have other students test the rules.
Ask:
For Question 5, students find how to get the next value of S (size in squares). Have students propose different rules and post these on the display. Then have other students test the rules. See Figure 4 for two possible strategies.
Ask:
In Questions 6 and 7, students write formulas for finding the new growth in squares (G) and the size in squares (S) based on the age in years (A). For students who are having difficulty finding formulas, it may be helpful to refer them back to the models they built with tiles and connect them to the numbers in the table.
Ask:
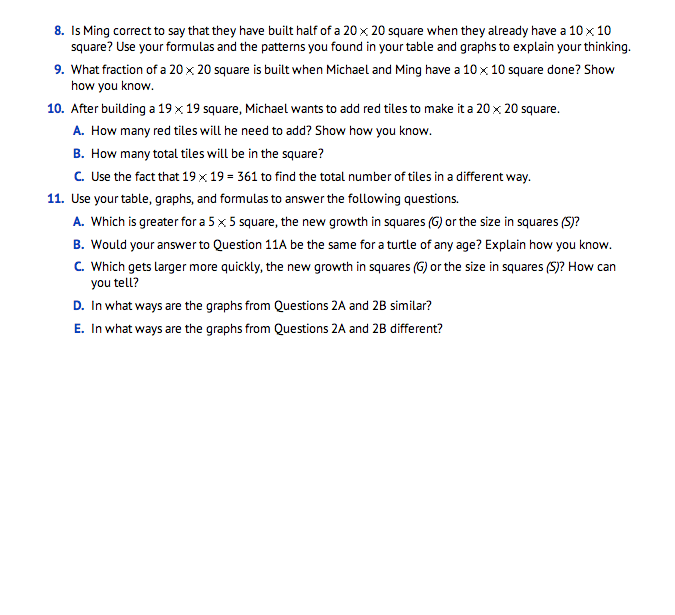
In Questions 8–9, students solve problems about the growth of the size of the square shell of the turtle. One of the characteristics of this growth pattern is that the size of the turtle does not grow at a constant rate. It grows 1 square in the first year, then 3 squares in the second, them 5 squares in the third and so on. The ratio of size to age (S/A) changes each year. Therefore, when the turtle is 10 years old, it has far fewer than half of the tiles of a 20-year-old turtle even though 10 is half of 20. This is because 10 × 10 = 100, whereas 20 × 20 = 400. Therefore, only 1/4 of the squares have been placed for a 20 × 20 square when Michael and Ming have a 10 × 10 square done (Question 9).
In Question 10, students make predictions about the growth pattern of the Square Shell Turtle. They use graphs, tables, and formulas to make their predictions.