Allow adequate time to complete the data collection in one class session. The data won't be the same with a change of clothing.
Gather Data. Begin the lesson by commenting
about yesterday's homework asking everyone to
wear clothing with pockets today and how it made
you wonder about the number of pockets the class
would have, as well as other questions.
- What do you think is the greatest number of pockets
someone is wearing today? What do you think
is the smallest number?
- What do you think is the total number of pockets in our class today?
- Would 20 pockets be a good estimate of the total? How about an estimate of 300?
- How can we find answers to these questions?
Briefly discuss how students determined if 20 and
300 are reasonable estimates. Congratulate the suggestion
of using a data table as in Lesson 1, Favorite
Colors, in response to the last prompt. Remind students
that using efficient strategies and tools is a
good math practice. Then introduce the graph as
another tool for organizing and keeping track of the
data the class will collect to answer these questions.
Suggest using connecting cubes to help keep track of
their pockets. Demonstrate by placing one cube in
each of your pockets. Then remove all your cubes
and connect them to make a cube train. Ask students
to complete this process. Ask students to count the
number of cubes in their trains.
Connecting cubes help those students still working on
one-to-one correspondence keep track and count pockets
and also serve as a visual representation helping bridge
concrete (pockets) to symbolic (number) representations of
the number of pockets. If the students in your class do not
need the aid of the cubes you can simply have each student
use the self-adhesive note to write his or her name and the
number of pockets worn below it.
To get an accurate survey, ask students to set aside any extra cubes that are not used.
Ask all students with a given number of pockets (e.g.,
three pockets) to line up in front of the class and show
their cube trains. Check that students have the right
number of cubes in their trains by counting and comparing
to see that all are the same length. Repeat this
procedure with other numbers of pockets.
Graph the Data. Call attention to the graph you
prepared before class, reading the title and labels
including abbreviations on both the horizontal and
the vertical axes. Explain or elicit from students
what the numbers on each axis represent. Tell students
that the graph will help us remember and organize
the data about the number of pockets each
student is wearing today. Explain that the graph will
give us a picture of the data and help us find answers
to the questions posed at the start of class.
Instruct each student to write his or her name on a
self-adhesive note. As you name a value from 0 to
12, students with that number of pockets (and length
of cube train) bring their notes to the graph. Students
should place their own self-adhesive notes on the
graph to develop a concrete understanding of what a
graph represents.
Make sure students place their notes on the lines
above the numbers and not in the spaces between.
This is a scientific convention that is used throughout
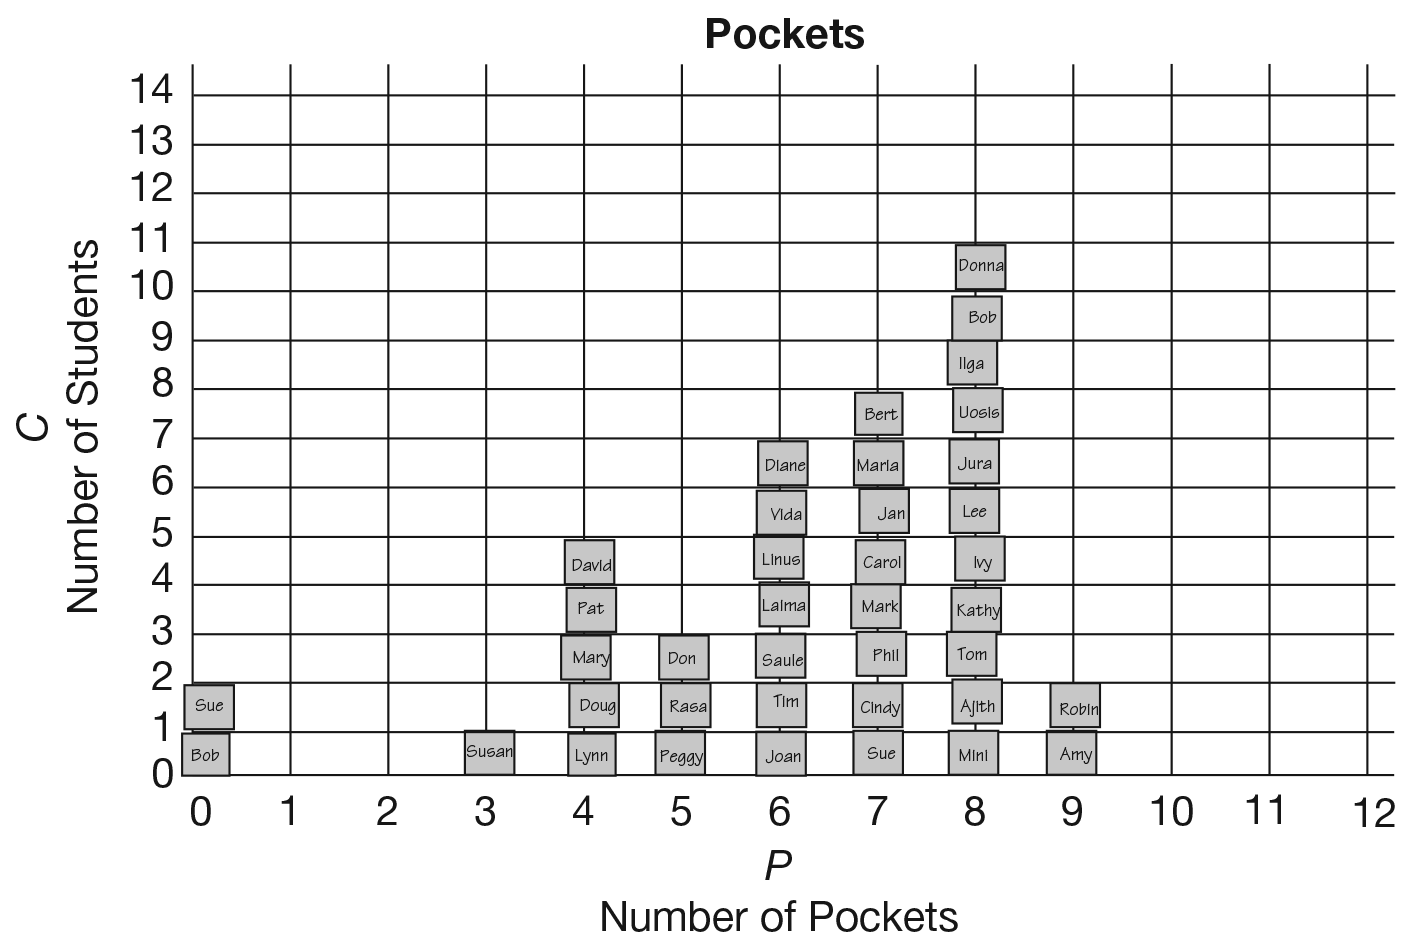
the curriculum. A sample graph is shown in
Figure 3.
Have a student who has no pockets place the self-adhesive note on the vertical axis—the zero line.
Ask students with two pockets to stand. Count the
number of students standing. Write the number on
the board. Count the number of self-adhesive notes
above the number two on the bar graph.
Ask the following questions:
- Should the number of students standing and the
number of self-adhesive notes be the same? Why? (Yes, because each student put a note on the
graph. The graph shows everybody here today.)
- If I read the names on the notes above the number
two, should they be the names of the people
standing? Why? (Yes, because they are the people
who had two pockets. They stood up for two
pockets and they put their name on the graph for
two pockets.)
Repeat this process with other numbers of pockets.
If your students wear uniforms there may not be much
variety in the data. You may choose to have students collect
the data anyway and talk about why all the students seem to
have a similar number of pockets. Show students the data in
Figure 3 and ask whether they think these students are
wearing similar clothing or whether their outfits have more
variety.
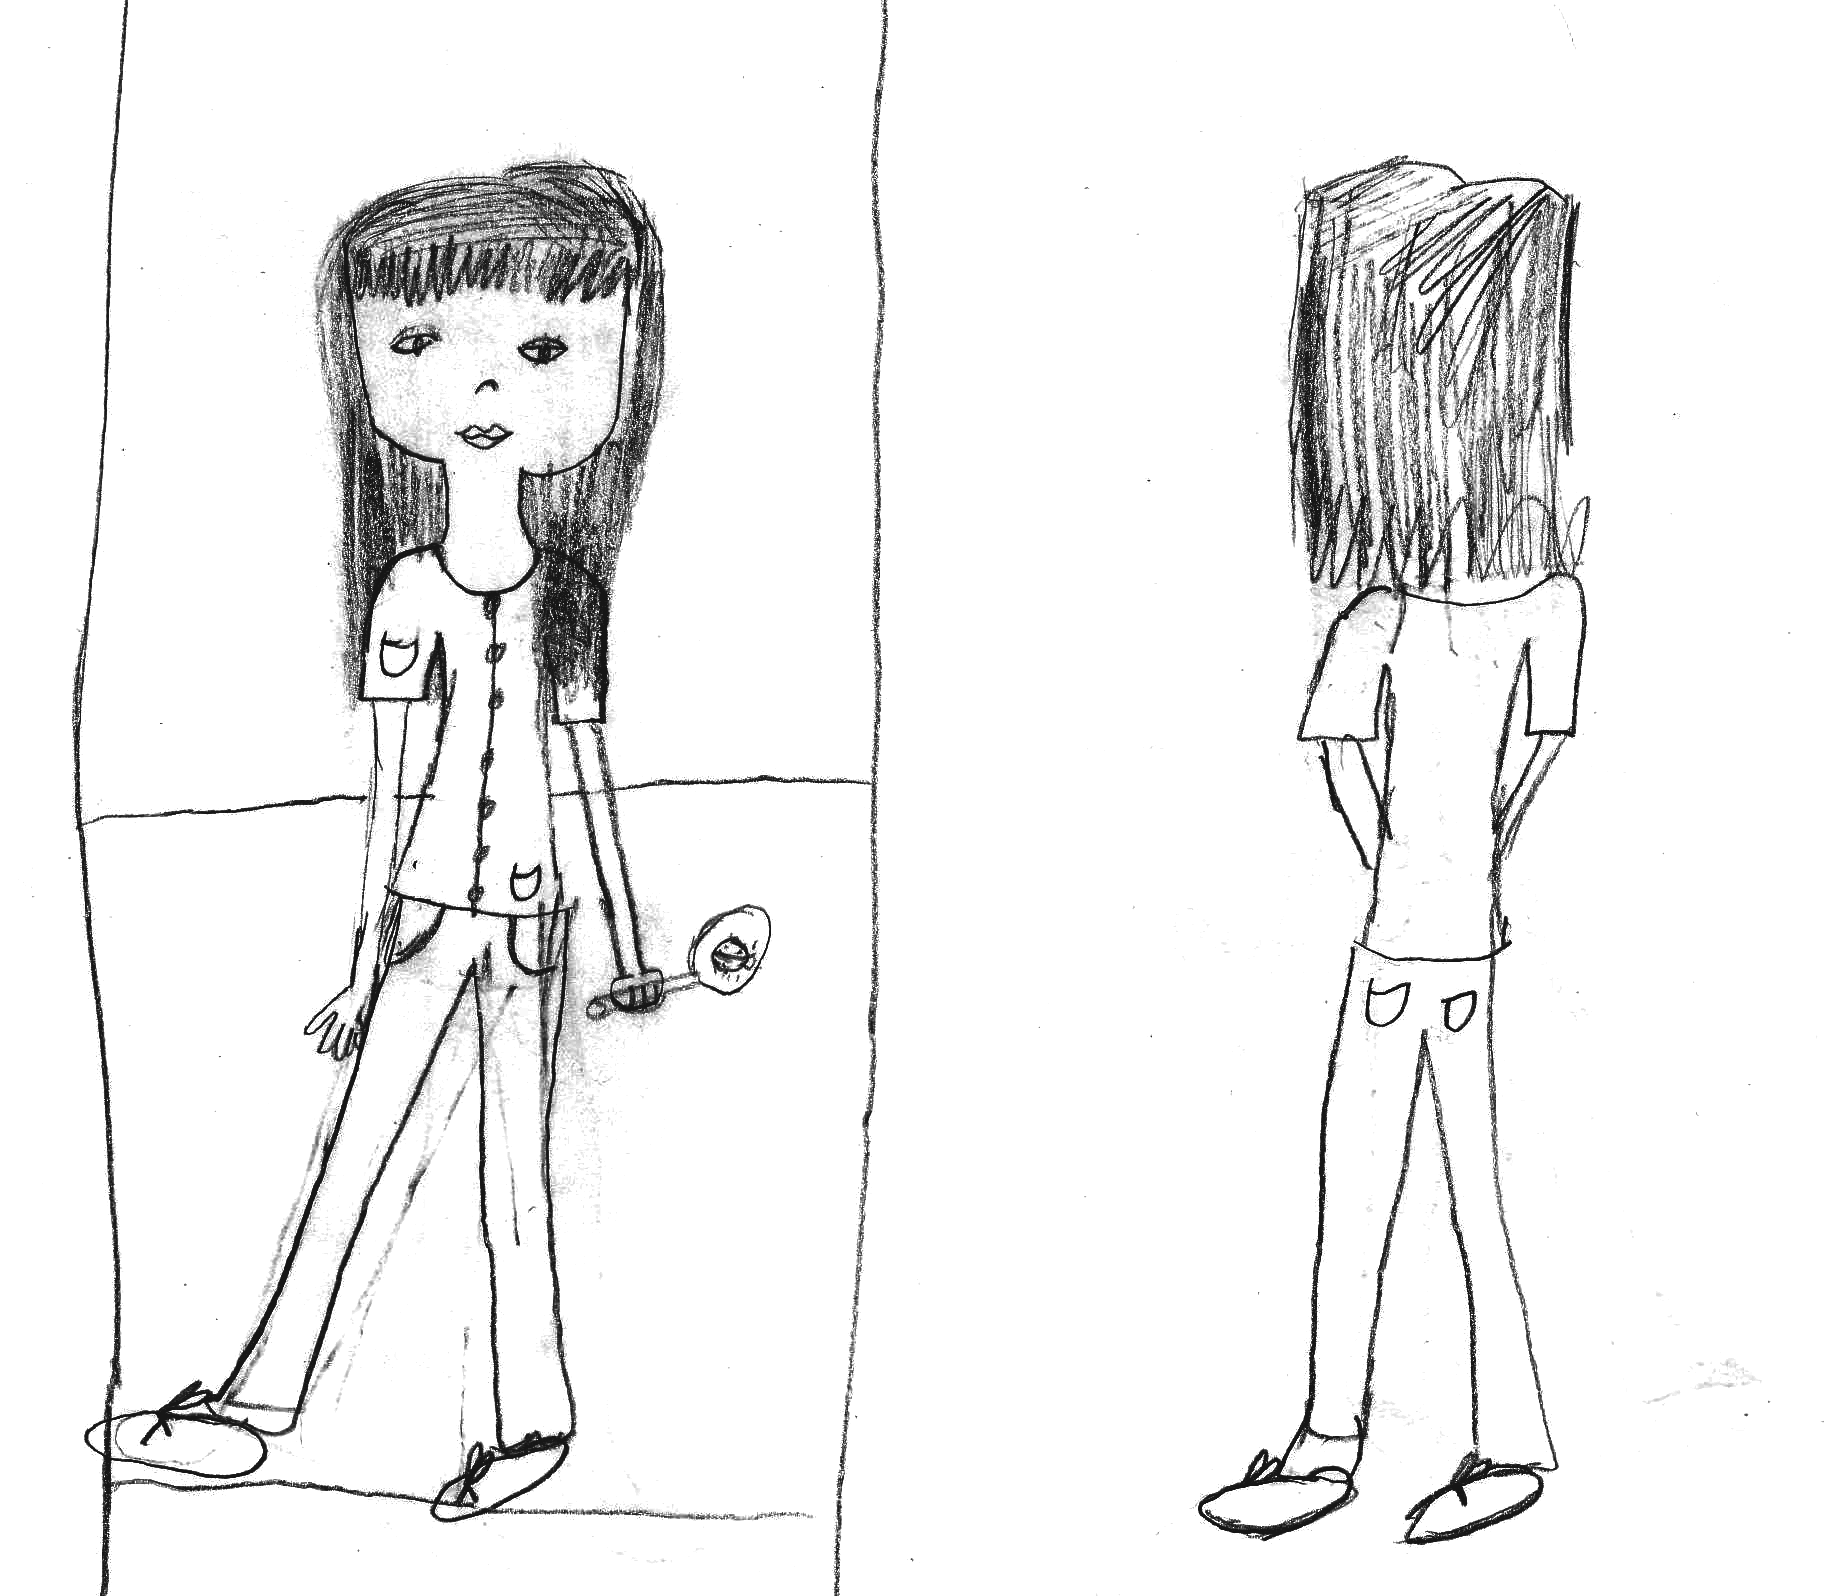
Rather than asking students to wear an outfit with pockets,
you may choose to have students draw or take a picture of
themselves wearing an outfit with pockets. Be sure students
show the pockets on the front and back of their outfits. See
the drawing below.


Representations Support Strategy Development. Observe
students as they work on questions requiring addition.
Students can use fingers as a support for counting on, but
watch for students who use counting all as the strategy they
use repeatedly. Students who count from one repeatedly
need to be encouraged to start with the larger addend, add
the number of counters or fingers for the second addend,
then count on to determine the answer more efficiently. Look
for opportunities to help students use 5 and 10 as
benchmarks to help them develop the strategy of counting
on. Ten frames provide a visual representation of these
benchmarks.
Gather Questions about the Data. Begin the
analysis of the data represented in the bar graph by
asking students to think about what the graph is
showing. Encourage them to think of questions
about the data. As students share their questions
aloud write each question on the front of one of the
question cards you prepared. See Materials
Preparation. Some sample questions are listed here
and are based on the data represented in Figure 3. If
students do not think of the questions listed, introduce
them into the discussion using your class data.
Students will work in pairs to answer the questions
later, so record at least one question for each pair of
students and two additional questions for class discussion.
- Which number of pockets is most common?
(8 pockets. It is the tallest bar on the graph.)
- Which is the least common? (3 pockets. Only
one person had three pockets and it is the shortest
bar on the graph.)
- Who has the least number of pockets? (Sue and
Bob had zero pockets.)
- Who has the most pockets? (Amy and Robin had
9 pockets; it's the biggest number.)
- If a new student walked in, how many pockets do
you think he or she might have? (The tall bars mean
more people had that number of pockets. So 8 is
the highest, but 7 and 6 pockets are pretty close
to 8, so maybe the graph means the new student
would have
6 or 7 or 8 pockets.)
- How many students have clothes with five pockets?
(3 students)
- What is the total number of students who have
more than seven pockets? (It's 13 students,
because
8 pockets is 11 students and 9 pockets is
2 students.
11 + 2 = 13.)
- What is the total number of students who have
four, five, or six pockets? (Four pockets shows
5 students, five pockets is 3, six pockets is 7;
5 + 3 + 7 = 15 students.)
- How many more students have 8 pockets than
6 pockets? (4 more students; I compared the
columns and counted on.)
- How many fewer students have 5 pockets than
7 pockets? (5 fewer students; I compared the
columns and counted on.)
- Are students more likely to have 5 pockets or
7 pockets? (7 pockets because more students
have
7 pockets.)
- I want a group of 5 students. There are 3 students
with 6 pockets. Which other group of students can
join them to make a group of 5 students? (There
are 2 students with zero pockets and 2 students
with
9 pockets. Either group of students could
join the
3 students with 5 pockets to make a
group of
5 students.)
- I want a group of 10 students. There are 7 students
with 6 pockets. Which other groups of students
can join them to make a group of 10 students?
(There are several ways to add 3 students to this
group. The
2 students with 0 pockets and the
1 student with
3 pockets could join them, the
2 students with 9 pockets and the 1 student with
3 pockets could join them, or the 3 students with
5 pockets could join this group.)
- How many students have 5 pockets? (3 students
have 5 pockets.) More students joined the class.
Now 5 children have 5 pockets. How many students
joined the class? (2 students joined the
class because there were 3 students and now
there are 5 students with 5 pockets.)
- How many students have 6 pockets? (7 students
have 6 pockets.) More students joined the class.
Now 10 students have 6 pockets. How many students
joined the class? (3 students joined the
class because there were 7 students with 6 pockets
and now there are 10.)
- How many students have 8 pockets? (11 students
have 8 pockets. I counted the tally marks.) Some
students left. There are now 10 students with
8 pockets. How many students left the room?
(1 student left the room. There were 11 students
with
8 pockets and one less is 10 students with
8 pockets.)
These kinds of questions and the related discussion
help students to reflect on the "story" of the data represented
in the graph.
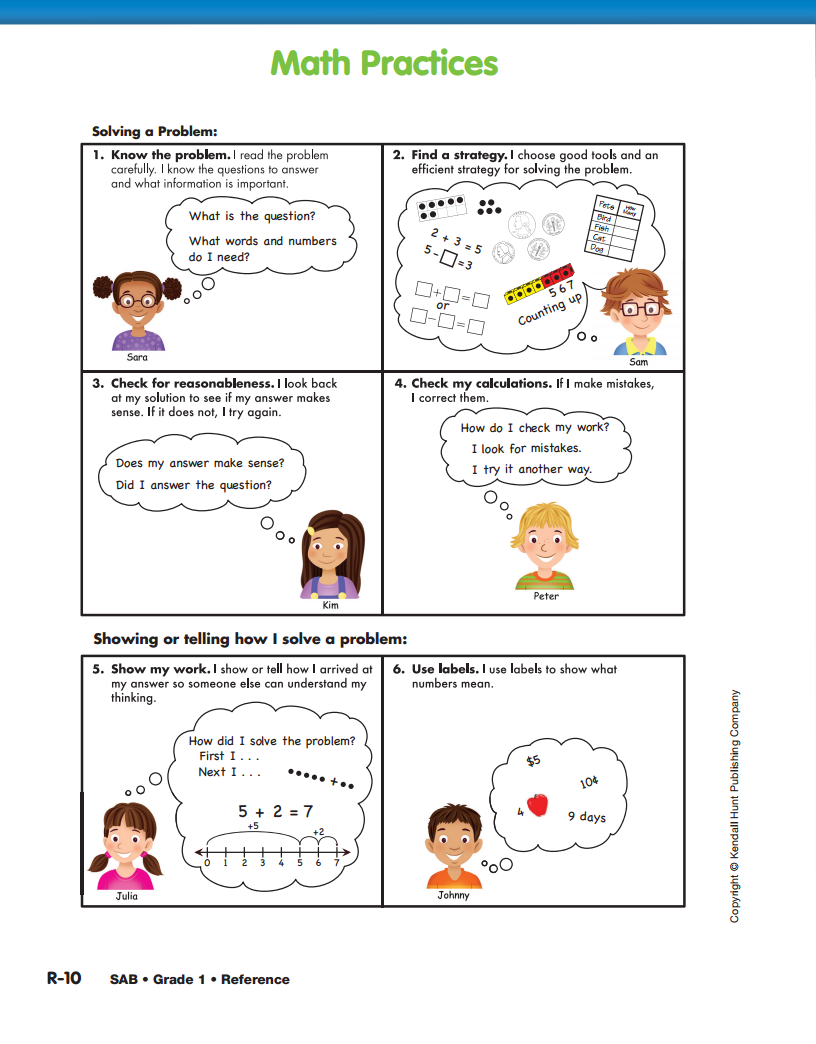
Analyze the Data. Display the Math Practices page
in the Student Activity Book Reference section and
discuss Math Practices Expectation 5, Show my
work.
Pose a question about the graph such as:
- How many [more, fewer] students have [number] pockets than [number] pockets? Tell how you know.
Record the question on one of the question cards you prepared. Ask students to show or tell how to use the
graph to answer the question. Students should be
able to show which information from the graph they
used. For example, if you asked how many more students
have 7 pockets than 3 pockets, students might
show that they compared the 7-pockets column and
the 3-pockets column and then counted on to figure
out how many more pockets they need to get to 7.
Other students might determine the number of students
for each number of pockets and then use their
fingers or counters to solve 8 − 1.
After hearing the different strategies from students,
record the answer to the question on the inside of the
question card. See Figure 2. You may want to represent
the answer in a variety of ways to show students
that there are many ways to show their answer:
drawing, number symbol, and/or words.
Tell students they will now have a chance to answer
some of the questions they generated. Remind students
to record their answer on the inside of the card
and, while referring to Math Practices Expectation 5,
that they should be prepared to show or tell how
they answered the question. As you distribute the
question cards to each pair of students, read the
question aloud once or twice.
Give students a chance to interpret their assigned
question. Some students may need their question
read again. Some students may also need to work
more closely with the displayed graph. Circulate
among the pairs supporting students' thinking and
their interpretation of the question. Allow students
some flexibility in communicating their answer.
Students could draw a picture or write symbols or
words. It is important that they can read and share
their answer and be ready to show others how they
came to that answer. See the Meeting Individual
Needs Box for additional instructional strategies to
help students access the question and share their
solution strategies.
Observe students while they analyze the data using their
assigned question to assess students' abilities to read a bar
graph [E9] and to explain how they arrived at their answer so
someone else can understand their thinking [MPE5].

- Encourage students to use invented spelling and
drawings to first interpret their assigned questions and
then share their answers and solution strategies.
- Distribute fewer questions to the class at a time and
have students devise a solution and answer orally with
some writing. For example, ask half the students to
focus on one question and the other half of the class to
focus on another question. Then have one or two
students from each group share their solution strategies.
- Recording devices may help students listen to the
questions written on the question cards and share their
strategies for analyzing the graphs. Students can listen
to the question repeatedly, and these devices can help
capture student thinking. Voice recognition software may
also be used to translate students' oral language into
text.
- Use the inherent variety in the questions to meet the
individual needs of students.
After students have had adequate time to record
answers to their assigned questions, pose each question
aloud to the class providing time for students to
silently determine the answer. Then display the written
answer and have the authors explain to the class
how they arrived at it using the graph or using the
data to make predictions.


