


Pockets Graph
Est. Class Sessions: 1–2
Using connecting cubes, students collect data by counting the pockets in their clothing. They use this data to construct a group bar graph, setting the context for future lessons with partitioning numbers.
Content in this Lesson
- Collecting, organizing, and analyzing data using a bar graph.
- Reading a bar graph to find information and make predictions about a data
set [E9]. - Modeling real-world situations with a bar graph.
- Making predictions and generalizations about a data set using a bar graph.
- Telling how a graph is used to solve problems [MPE5].

Materials for Students
| Daily Practice and Problems | Lesson | Homework | Assessment | ||
|---|---|---|---|---|---|
Student Books |
|||||
| Student Activity Book |
|
||||
Teacher Resources |
Teacher Guide - digital |
|
Supplies for Student Groups
20 connecting cubes
3 inch X 3 inch self-adhesive note
Materials for the Teacher
Display of the Math Practices page (Student Activity Book) Reference
Unit 3 Assessment Record
chart paper to display graph. See Materials Preparation.
drawing or copy paper. See Materials Preparation.
connecting cubes
Materials Preparation
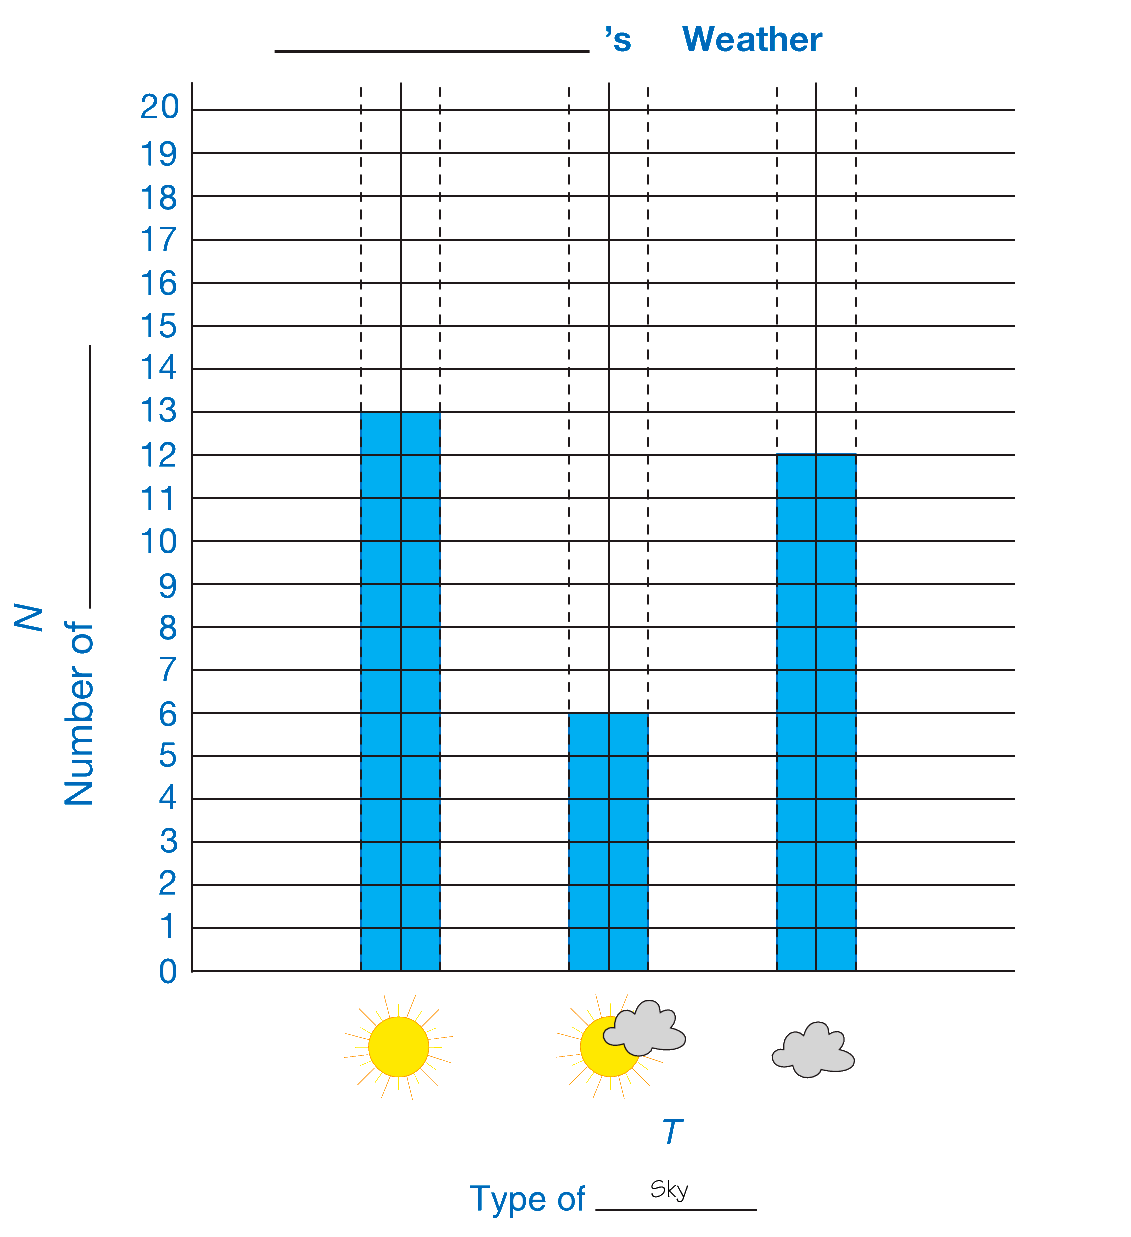
Make a Graph. Prepare a graph on chart paper or other display as shown in Figure 1. Make sure that your graph columns are large enough to hold the self-adhesive notes.
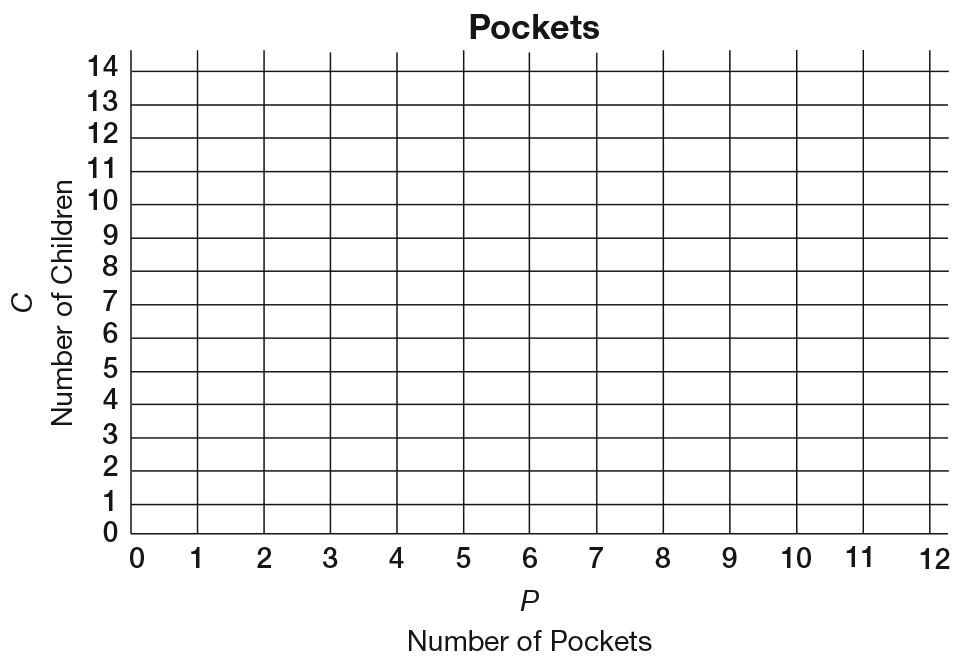
Figure 1: The empty graph
Prepare Question Cards. Fold several pieces of drawing or copy paper in half so the long edges meet. With the fold at the top, cut these in half from top to bottom forming two smaller cards. These will be used when analyzing the data in the graph. Cards will be held with the fold at the top opening from the bottom similar to a greeting card. See Figure 2.

Figure 2: Question cards for analyzing data
Assessment in this Lesson
| Assessment | Expectation Assessed | Math Practices Expectation Assessed |
|---|---|---|
|
Pockets Graph Observe Analyze the Data Teacher Guide - digital |
|
|
|
DPP Item H What Number? 3 Teacher Guide - digital |
|