Lesson 4

Our Favorite: A Data Collection Lab

Est. Class Sessions: 2

Summarizing the Lesson

Find Errors in Sample Data. To apply the concepts covered in this lesson, have students work in pairs to review the Mrs. Dawson's Class page in the Student Activity Book. Tell students to pretend they are teachers and ask them to look closely at the table and graph. Have partners discuss what they would tell the students in Mrs. Dawson's class about collecting, organizing, and graphing data. There are several errors between the table and the graph including:

  • The label for the vertical axis should read “Number
    of Students.”
  • The first fruit on the data table is “apple.” On the graph it
    is “pear.”
  • The labels for “orange” and “banana” are in reversed order from data table to graph.
  • The data table says 5 students chose orange as their favorite and 10 chose banana; the graph shows
    10 students chose orange and 5 chose banana.
  • The data table shows 7 students chose watermelon and the graph shows 9.

After student pairs have had time to review Mrs. Dawson’s class’s work, display the Mrs. Dawson’s Class page and have students show the errors or discrepancies on the display. See the Sample Dialog.

In the following Sample Dialog, the class discusses discrepancies and mistakes between the table and graph on the Mrs. Dawson’s Class page in the Student Activity Book.

Keenya: I found something that’s wrong! They mixed up the bananas and oranges.

Teacher: How are they mixed up?

Keenya: The banana is where the orange should be and the orange is where the banana should be.

Teacher: Are you talking about the graph or the table? And what do you mean by “where they should be”? Can you come show me on the display?

Keenya: [at the display, pointing to the graph] See, it says that the banana is 5 and it's really the orange that is 5.

Teacher: How do you know 5 students liked oranges best, Keenya?

Keenya: On the data table. The data table says the orange
is 5.

Teacher: And what does the graph show?

Keenya: The graph says the banana is 5.

Teacher: How does it say that?

Keenya: See, this bar goes to 5 and it says banana but the banana is supposed to be up to 10.

Teacher: Do you mean that the information in the data table and the graph are not the same? Do they have to be, Ming?

Ming: I think they have to.

Teacher: Why do you say that?

Ming: Because you make the graph from the data table.

Teacher: So you are using the same information in the data table and the graph, is that right?

Ming: Yes. It should be the same. So, if it’s 5 oranges, then it can’t be 10 oranges on the graph.

Teacher: Do you mean 5 oranges or 5 students?

Ming: Five students. If 5 students like oranges best, then the bar can’t go up to 10.

Teacher: So they have made a mistake. Can we tell where the mistake is? Is it on the data table or the graph?

Jacob: I think the graph is wrong.

Grace: But maybe the person who wrote the data table is wrong and the graph is right.

Teacher: We can’t really tell by just looking at it, can we? Usually we make the data table first, but maybe they made the graph first.

John: Yes. Maybe they made the graph by everyone putting a sticky note on it.

Teacher: Yes, that’s very possible. If we were Mrs. Dawson’s class, what could we do to find out what our mistake is?

Jessie: Maybe they could count all over again.

Romesh: Maybe they could count their tallies if they made tallies.

Teacher: Very good, those are both ways to find where a mistake is. Does anyone see other mistakes on Mrs. Dawson's data table and graph?

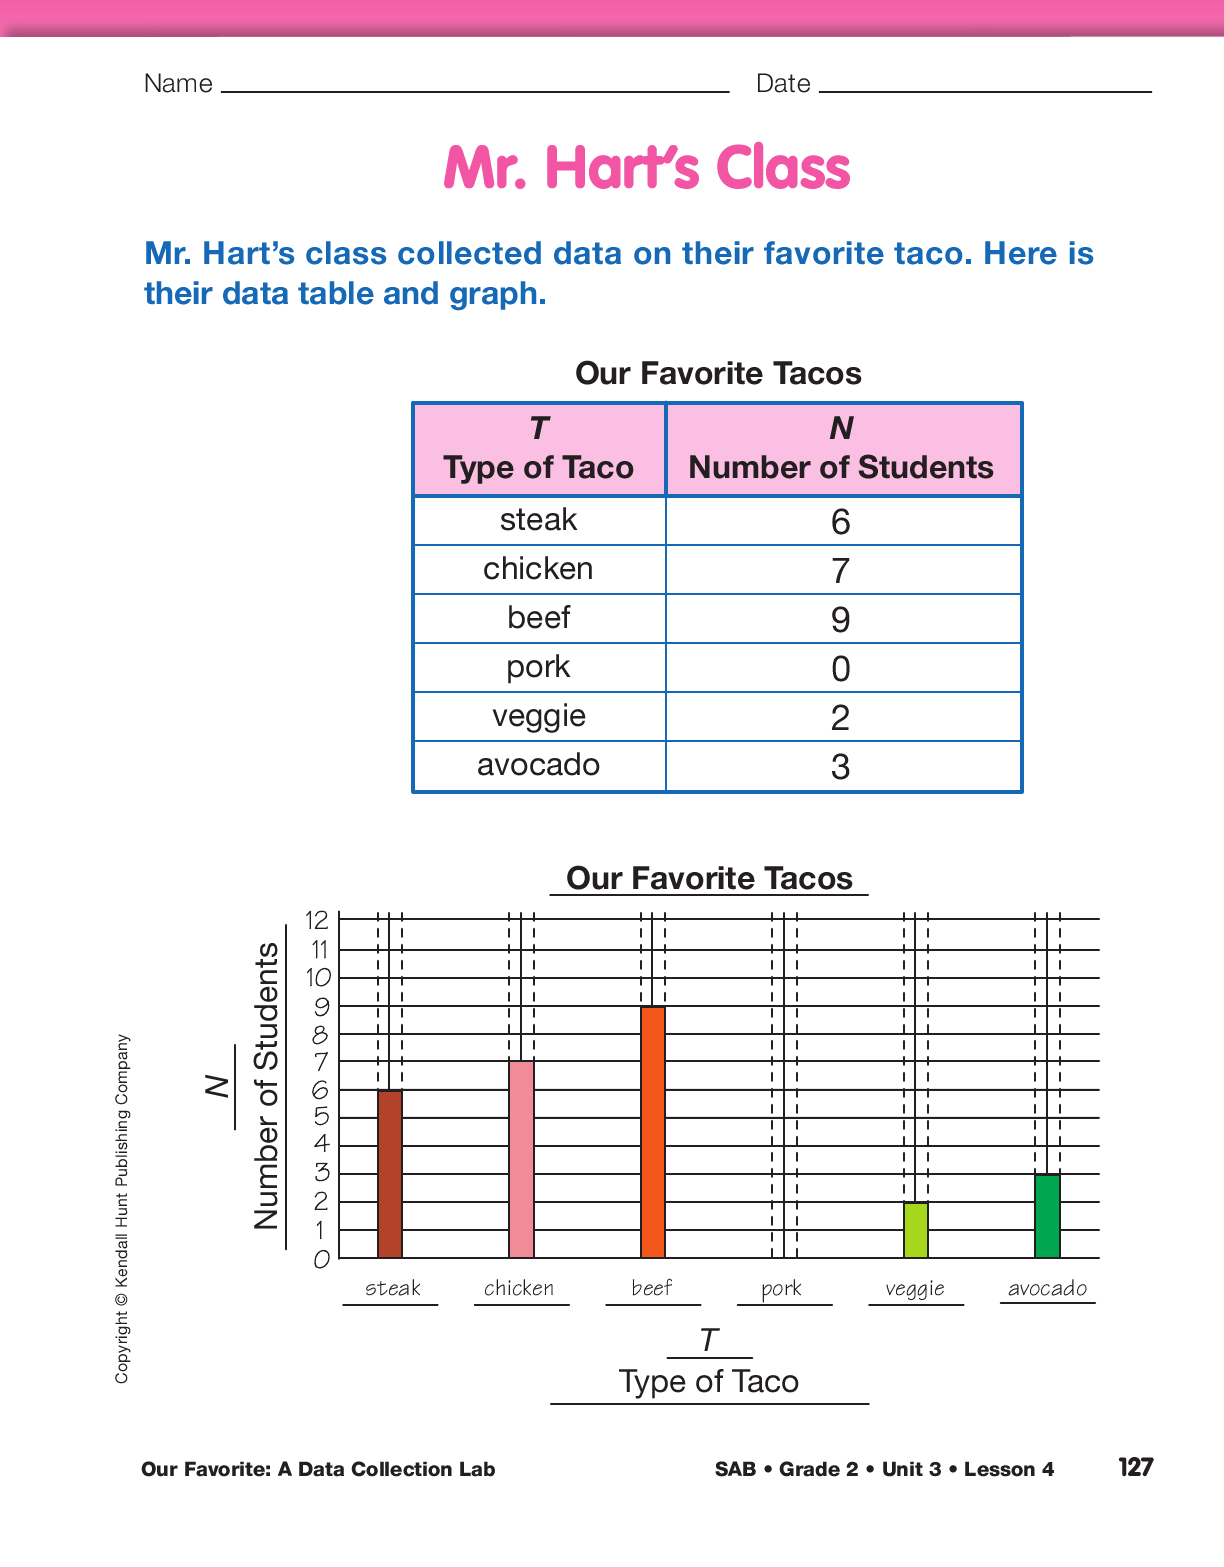
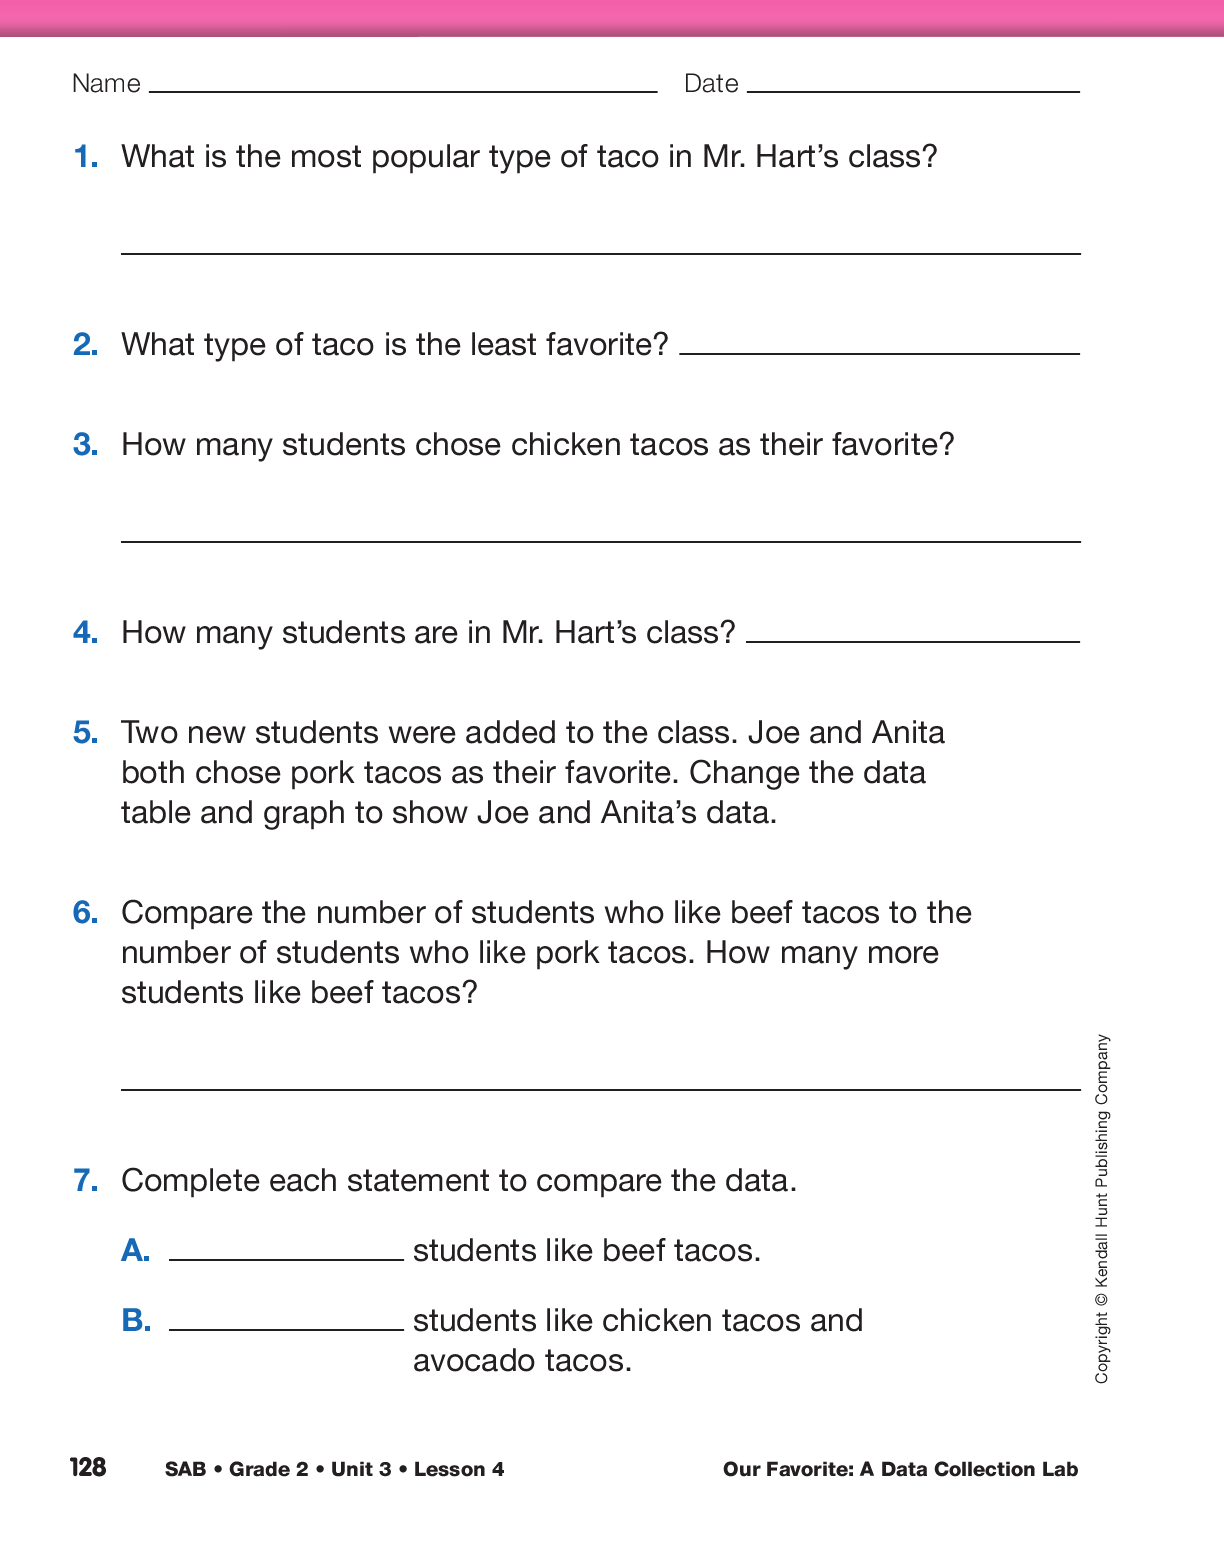
Analyze Mr. Hart’s Data. Direct students’ attention to the Mr. Hart’s Class pages in the Student Activity Book on which they interpret a data table and graph and answer questions about favorite tacos. Have students complete the Mr. Hart’s Class pages independently.

Use the Mr. Hart’s Class pages with the Feedback Box in the Student Activity Book to assess students’ abilities to solve word problems [E7], draw a bar graph from a data table [E8], and read a bar graph or table to find information about a data set [E9].

X
SAB_Mini
+
X
SAB_Mini
+
X
SAB_Mini
+
X
SAB_Mini
+