Read Story.
Read Alexander, Who Used to Be Rich
Last Sunday by Judith Viorst aloud. After you read
the book, ask student pairs to calculate each of
Alexander’s expenditures. Pass out one set of coins
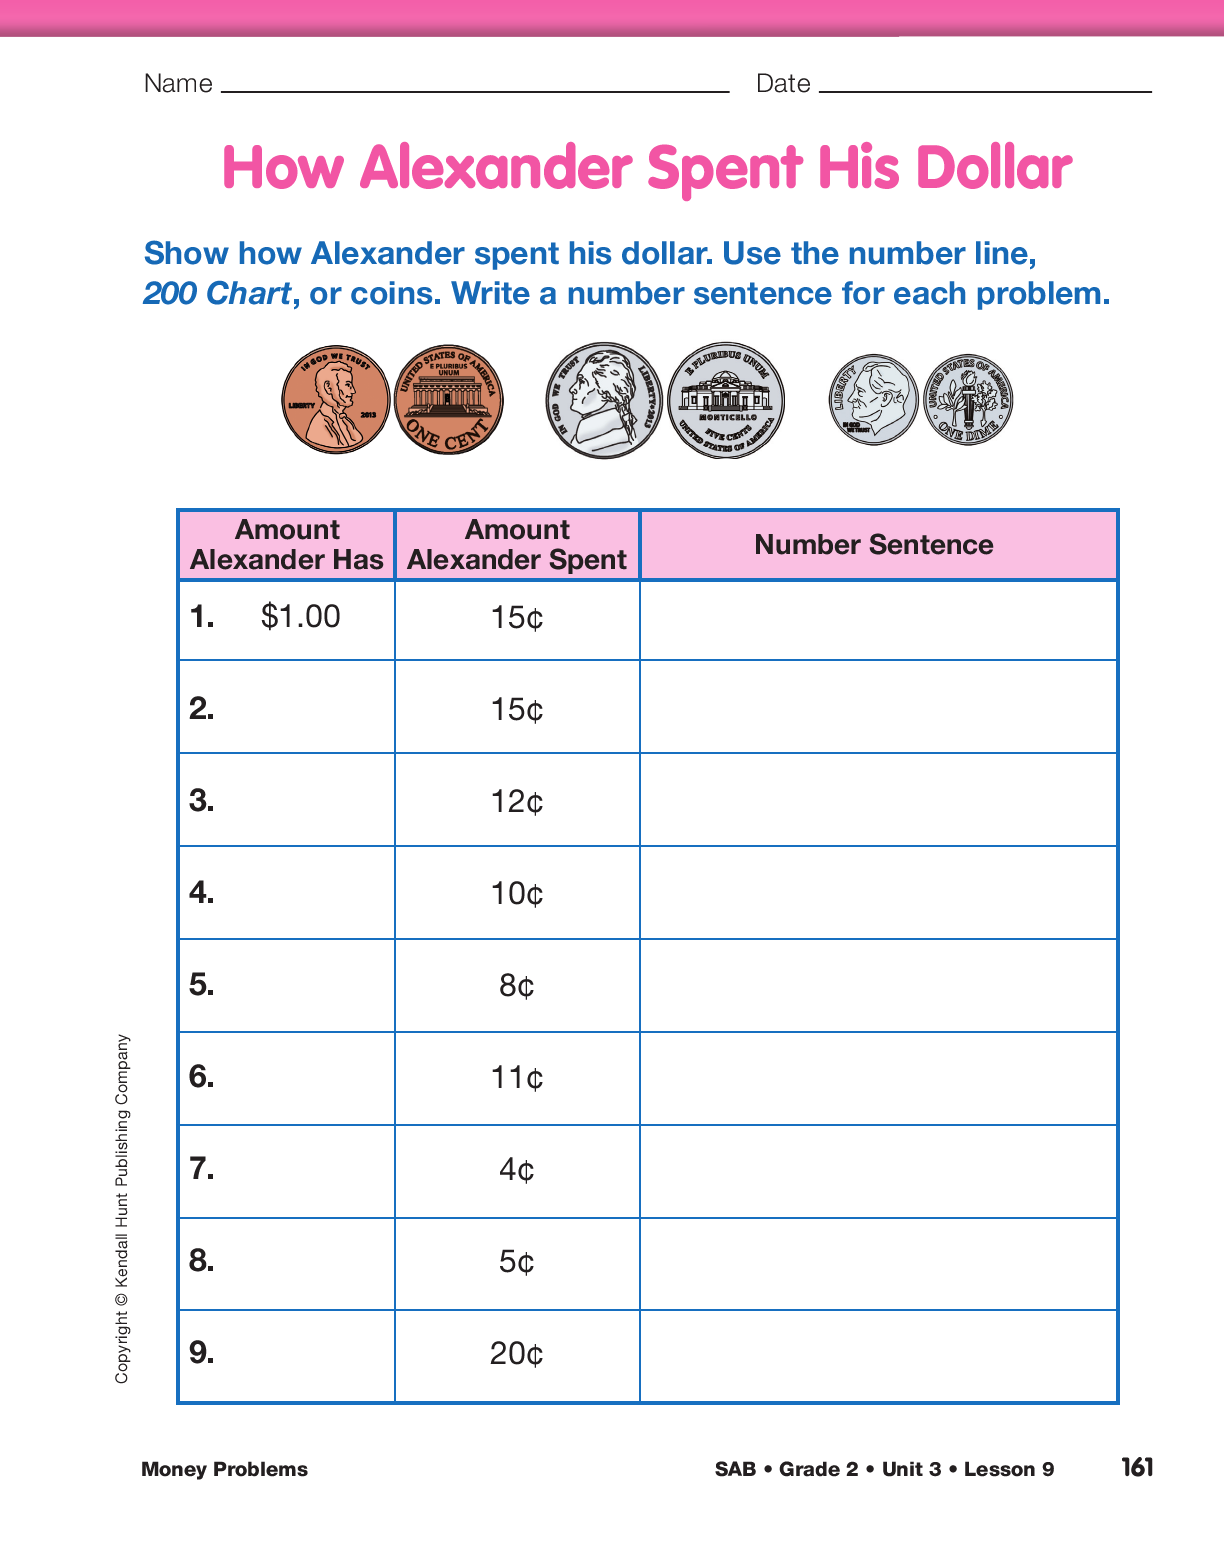
to each pair. Have students use the How Alexander
Spent His Dollar page in the Student Activity Book,
coins, the number line, and 200 Chart to calculate
and record the expenditures.
If you are unable to obtain a copy of this book, introduce
problems in which you are given a fixed amount of money to
spend at the store. For example: You have 90¢. You go to the
store and buy an eraser for 9¢. Then you buy a pencil for
12¢. How much do you have left? How much have you
spent?
It may be helpful to have a chart showing different
combinations of coins that have the same value as a dollar,
dime, and nickel so that students can refer to it during the
activity.
Calculate Alexander’s Expenditures. Demonstrate
the activity by using the display of How Alexander
Spent His Dollar from the Student Activity Book,
coins, the number line, and a display of the 200 Chart from the Student Activity Book Reference section.
- How many pennies equal a nickel? (5)
- How many nickels equal a dime? (2)
- How many pennies equal a dime? (10)
- How many pennies and nickels equal a dime?
(5 pennies and 1 nickel)
- How many cents are there in a dollar? (100)
Have students write 100 cents above $1.00 in the first row of the Chart on the How Alexander Spent His Dollar page.
- To begin the activity, we have to take 15¢ out of the
dollar. Find a good strategy for solving the problem.
What can we exchange the dollar for to make
it easier to take 15¢ out of a dollar? (Exchange the
dollar for dimes.)
- How many dimes equal a dollar? (10)
- The middle column shows how much money
Alexander spent each time. How much did he
spend on gum? (15¢)
- We have 10 dimes and we have to take away 15¢. How would you show that? (Possible response:
Exchange a dime for 2 nickels; If you take 2 dimes or 20¢ and take away 15¢, that leaves a nickel out of the 20¢.)

- Some students may prefer to use tools other than the 200
Chart or number line. To encourage students to learn to
use other tools, ask them to solve the problem using both
tools in parallel. Start with the tool they are comfortable
with and match that strategy on the
200 Chart or number
line.
- Some students may quickly come to a correct answer
without using any tools or articulating any strategy. The
explanations and strategies developed here will be used
again for more complex problems. Encourage students to
compare strategies and look for more efficient
strategies.
Have students demonstrate how to use the coins, the
number line, and 200 Chart to calculate Alexander’s
first expenditure. One student can indicate the moves
on the class number line, another student can indicate
the moves on the display of the
200 Chart, and a
third student can demonstrate how to use coins to
take away 15¢ from 100¢.
Reference the Math Practices page as you ask:
- How can we tell if these answers are reasonable?
(Possible response: We solved the problem using
different tools. All the answers are the same so
they make sense.)
- How much money did Alexander have left after he
bought the gum? (85¢)
- He had $1.00 and spent 15¢. What is the number
sentence? (100¢ − 15¢ = 85¢)
- When you write your number sentence, make sure
you use labels to show what the numbers mean.
What do the numbers mean in this problem? (cents)
- Now Alexander has 85¢ left. Each time you figure
out how much money he has left, write that
amount under the “Amount Alexander Has” column.
Tell students to work with a partner to complete the
rest of the chart. At times, they may need to
exchange coins. Students should use the number line
or 200 Chart to check their answers before they go
on to the next expenditure on the chart. Remind them
to use labels with the numbers. See the Sample
Dialog for possible responses for Question 3.
Upon completion, choose a problem and ask student
volunteers to demonstrate how they solved it using
coins, a number line, and a 200 Chart.

Use this sample dialog to guide your discussion of
Question 3 on the How Alexander Spent His Dollar page in the Student Activity Book.
Teacher: Alexander had 70¢ and spent 12¢ to rent a snake.
How did you use coins to solve the problem?
Brenda: I had 7 dimes. Since Alexander spent 12¢, I took
away 1 dime, but I had to take away two more cents. I
know that 1 nickel and 5 pennies make a dime, so I
exchanged 1 dime for a nickel and 5 pennies. Then I
had to take away 2 more pennies and I had 5 dimes, 1
nickel, and 3 pennies left. I counted 10, 20, 30, 40, 50,
and a nickel makes 55¢, and 3 pennies make 58¢.
Teacher: Who solved the problem using the number line?
Sam: I started at 70 on the number line. I made a jump of 10
back to 60 and counted back 2 more. I landed at 58.
Teacher: Who solved the problem using the 200 Chart?
Mary: I started at 70 and moved back 12 and I landed at 58.
Teacher: Did someone move on the 200 Chart in a different
way?
Javier: I started at 70 and moved to the number in the row
above because that’s how you subtract 10. There are
10
numbers in each row, so I can move faster just by
moving to the row above to subtract 10. I landed on 60
and I subtracted 2 more by moving to the left. My
answer is 58.
Teacher: Why do you think we use different tools to solve
this problem?
Eric: I think we use different tools so we can check our
answers to make sure they make sense.
Teacher: That’s right! It’s important to check our answers
to make sure they are reasonable answers.

Students may develop different ways to explain how they
used the 200 Chart to solve a problem. Some students will
use words to explain their thinking and others will use
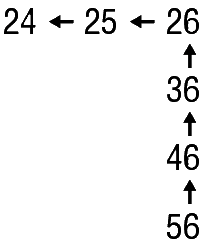
diagrams to solve a problem. The following diagram is a
shorthand method of demonstrating moves on the 200 Chart
to solve
56 − 32 = 24:
Observe students as they solve the problems on How
Alexander Spent His Dollar to assess their progress toward
identifying, describing, and using patterns on the 200 Chart
[E1]; connecting representations of quantities on the
200
Chart and in number sentences [E2]; and representing
subtraction using multiple representations (e.g., stories,
drawings, diagrams, counters, number sentences, number
lines, or on the 200 Chart) [E3]. Use these observations and
observations from previous lessons to decide which
homework assignment to give students.
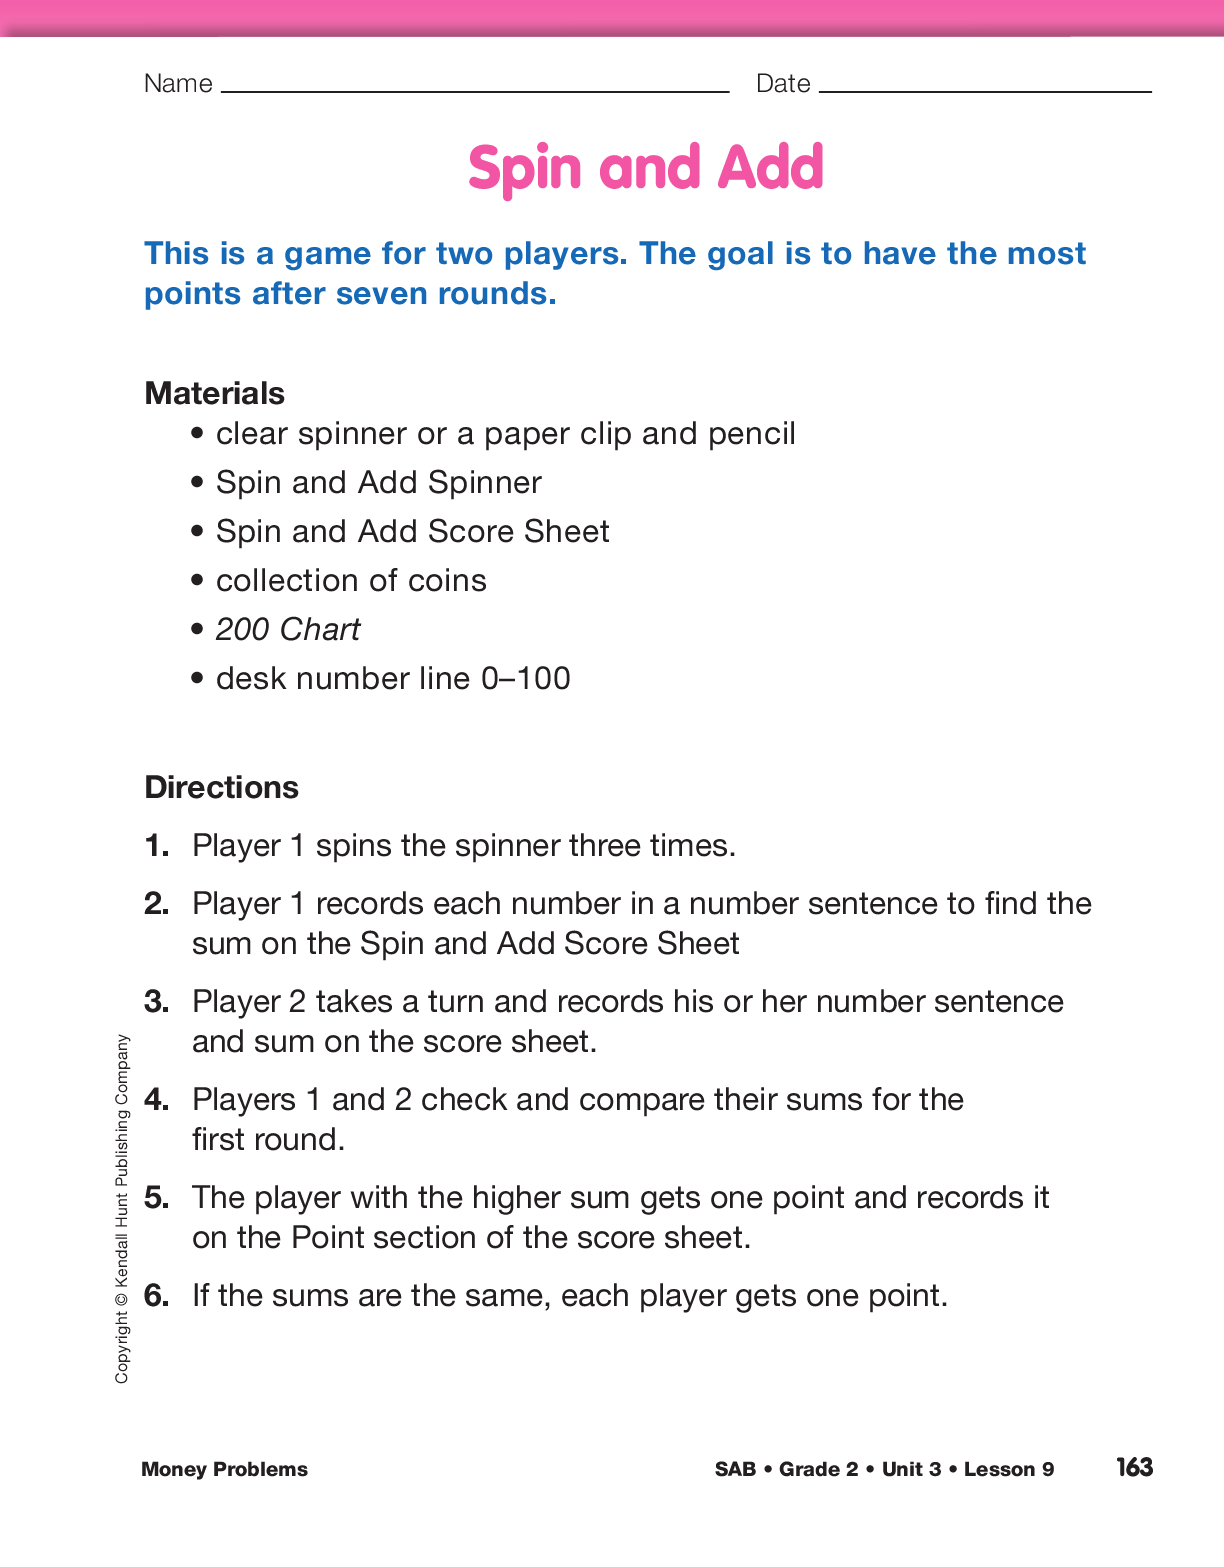
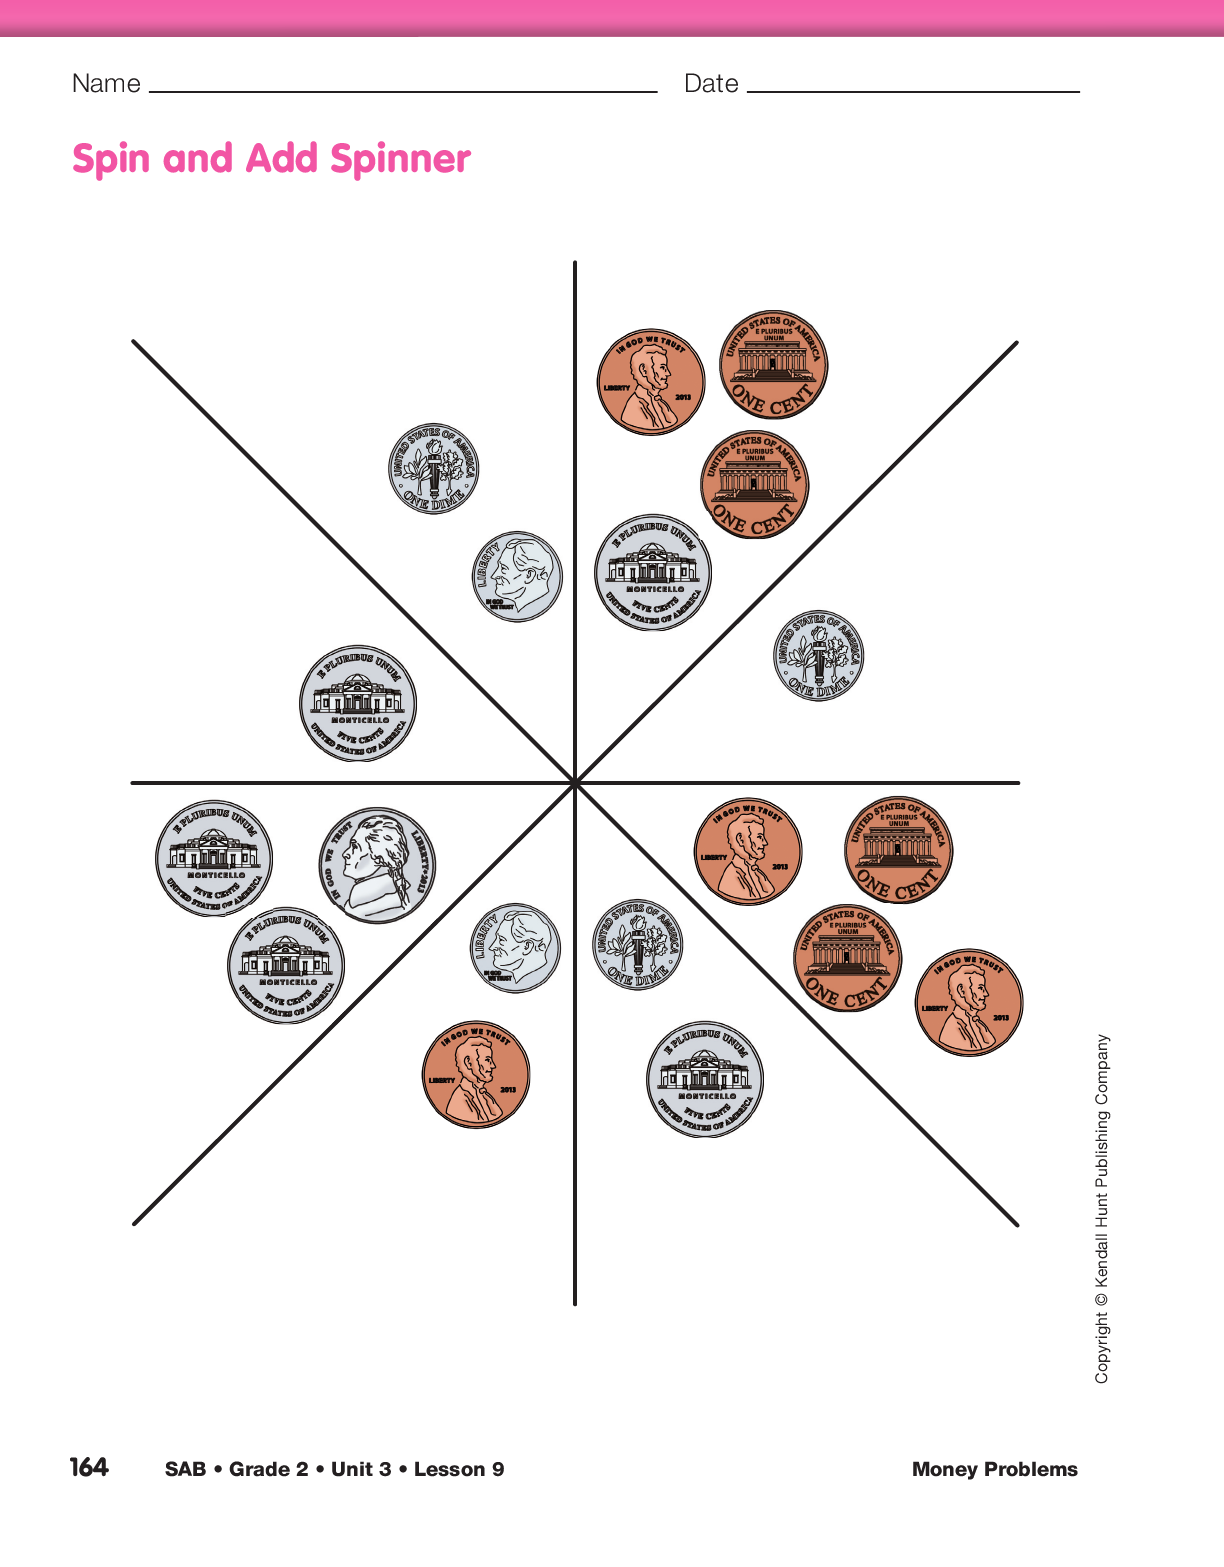
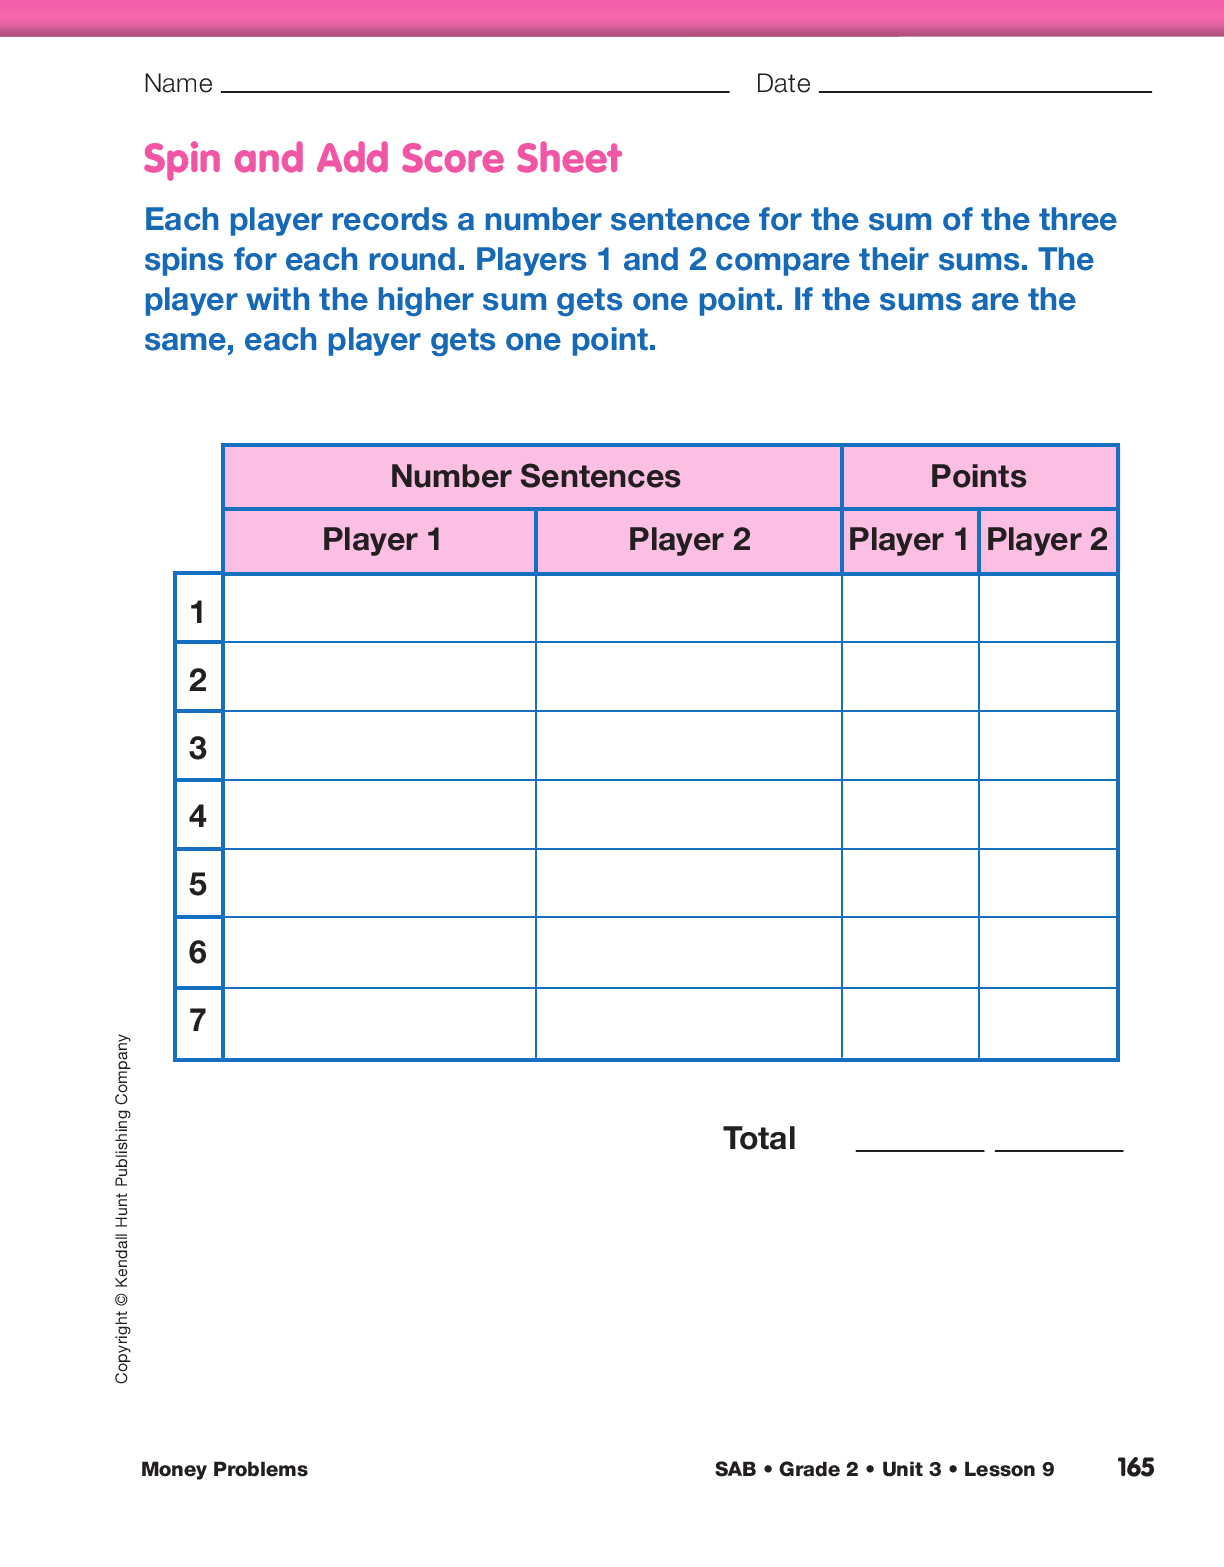
Play Spin and Add. Display the Spin and Add pages
from the Student Activity Book, including the Spin
and Add Spinner and Spin and Add Score Sheet sections,
to introduce the game and demonstrate how to
use the spinner, if necessary. Read the directions and
demonstrate the game with a volunteer. Each player
records a number sentence for the sum of three spins
for each round. Players compare their sums. The
player with the higher sum at the end of each round
gets one point. The goal of the game is to have the
most points after seven rounds. Explain that if the
spinner lands on a line, the player should put the
pointer into the area with the smaller amount of
money. To find the sum of the three spins, players
can use the 200 Chart, a number line, or count their
coins. Students should also find their partner’s sums
using a different tool than their partner. For example,
if one player found the sum using the 200 Chart, the
other player could count the equivalent coins or use
a number line. If there is a disagreement about the
sum and the two players cannot reconcile it by themselves,
it would be fair to ask another student pair to
check their work.


