lesson 5

Patterns on the 200 Chart

Est. Class Sessions: 2–3

Developing the Lesson

Part 1: Patterns on the 200 Chart

Find Patterns in Rows and Columns. These activities help students see that the patterns and relationships they observed in the first 100 numbers apply to numbers above 100. Show a display of the 200 Chart page from the Student Activity Book. Review the terms row and column. Remind students that a row is a horizontal line of numbers and a column is a vertical line of numbers. Ask students to briefly discuss patterns they see on the chart with a partner. Have them share the patterns they see using prompts similar to the following.

  • What patterns do you see when you go down a column? (Possible response: The first digit goes up by one, but the second digit stays the same like 23, 33, 43.)
  • Why does that happen? (Possible responses: Every time you go down a row you add ten. Each row on the chart is ten, so no matter what number you start on, you add ten when you move to the row below.)
  • What patterns do you see when you move across a row? Why does this pattern happen? (Possible responses: The first digit always stays the same but the last digit goes up by one until you get to the last number in the row. It’s like adding one when you count.)
  • Look at the rows. Where is the smallest number in each row? Where is the largest number in each row? (The smallest number is on the left at the beginning of the row and the largest number is on the right at the end of the row.)
  • Are the patterns for the columns the same on the whole chart? Do the larger numbers from 101 to 200 have the same patterns as those in 0 to 100? (Possible response: Yes and no. It’s still adding ten every time you move one row below. The last digit stays the same and the second digit still goes up by one, but now the first digit is always 1 until you get to 200.)
  • Are the patterns for the rows the same on the whole chart? Do the larger numbers from 101 to 200 have the same patterns as those 0 to 100? (Possible response: Yes, except now with three digits the first two stay the same and just the last one goes up 1, until you get to the last number in the row.)

See the Sample Dialog for further discussion about 200 Chart patterns.

Use this Sample Dialog to guide a discussion of patterns on the 200 Chart.

Teacher: What patterns do you see on the 200 Chart, Benjamin?

Benjamin: When I go to the row below, the first digit goes up by one.

Teacher: Can you give me an example?

Benjamin: Sure. If I start at 46, the next number below is 56, then 66, then 76.

Teacher: Does everyone see the pattern that Benjamin sees? Maria, can you say it in your own words?

Maria: When you go down a line, the first digit adds one and the second digit stays the same.

Teacher: Wow! So when we go from a number to the number just below it, how many are we adding? Marcus, what do you think?

Marcus: There are ten from 46 to 56. I counted them. So it is adding ten.

Teacher: Do you think that works every time we move from one row to the next row? Is it like counting ten or adding on ten each time?

Keenya: I counted like Marcus did, and it was always ten between numbers on top of each other.

Teacher: Why does that happen? Is there something about the rows in the chart that makes that happen each time?

Keenya: I get it. There are ten numbers in each row!

Teacher: Good thinking. Does anyone see another pattern in the chart?

Alexandria: If I stay on the same line but go across this time, all the numbers start with the same number, except the last one.

Teacher: Can you give us an example?

Alexandria: Yeah. Look at the line that starts at 21. The next number is 22, then 23, all the way to the end, except the last one. The last one starts with a 3.

Teacher: The line that Alexandria is talking about that goes across is also called a row. And the line that Benjamin was talking about that goes up and down is called a column. Can someone restate the patterns that Benjamin and Alexandria were talking about using the new words: column and row?

Judy: When you go down a column the numbers get bigger by ten more. And when you go along a row, the numbers get bigger by one more.

Teacher: Anyone else see a different pattern? Peter?

Peter: The bigger numbers, the ones with three numbers in them, look like they follow the same patterns as the numbers with two digits in them.

Teacher: Could you give us an example?

Peter: Look at 11, 12, that row. Now look at 111, 112, that row. The rows are alike except that one row has two digits, and the other row has three digits. But the pattern is the same. You just add one to go to the next number.

Teacher: And what if I go to the number just below it in a column? What might happen? Elizabeth?

Elizabeth: You still are adding ten to get to the next number.

Teacher: What wonderful pattern finders we have.

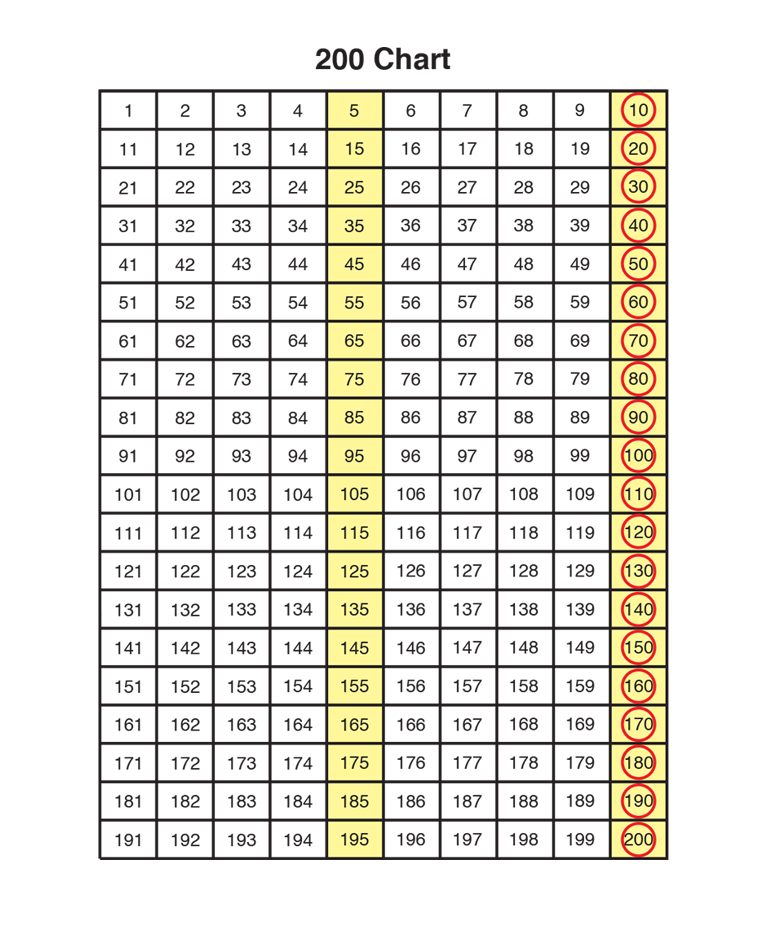
Skip Count by Fives. Display and direct students to the
200 Chart page in the Student Activity Book. Ask students to skip count by fives to 100. As each number is called, color it yellow on the display. Invite students to color the multiples of five yellow on their 200 Chart page. As soon as someone recognizes the emerging pattern, stop and discuss it with the class. See Figure 1.

  • What patterns do you see? (Possible responses: All the numbers in the first yellow column end in five; all numbers in the second yellow column end in zero.)
  • Where are the two yellow columns located? (Possible responses: The first yellow column ending in five is the middle column. All numbers in the second column ending in zero are the last column.)
  • Will we color [85] if we continue counting? (yes)
  • How do you know? (Counting by fives ends in a five or zero and [85] ends in 5.)
  • Will we color [173]? (no)
  • How do you know? (Counting by fives ends in a five or zero.)
  • Let’s use the pattern to finish coloring the chart. (Color all the numbers ending in 5 or 0 yellow.)

Skip Count by Tens. Next ask students to start at 10 on the chart and skip count by tens. As each number is called, have students circle the multiples of ten in red. Model this on the display. Encourage students to discuss the patterns they see. See Figure 1.

  • What pattern do you see now? Describe the pattern. (Possible response: All the numbers are in one column and all the numbers end in zero).
  • How many total circles have you placed on your
    200 Chart?
    (20)
  • Where are they located? (in the last column)
  • Let’s start at 8 and skip count by tens to 88. (8, 18, 28, 38, 48, 58, 68, 78, 88)
  • Start at 117 and skip count by tens to the last row of the chart. (117, 127, 137, 147, 157, 167, 177, 187, 197)
  • What number is 40 more than 23? (63) What number sentence represents these moves? (Possible responses: 23 + 10 + 10 + 10 + 10 = 63; 23 + 40 = 63)
  • What number is 30 more than 138? (168) What number sentence represents these moves? (Possible response: 138 + 10 + 10 + 10 = 168; 138 + 30 = 168)
  • Start at 44, what number is 30 less? (14) What number sentence represents these moves? (Possible response: 44 − 10 − 10 − 10 = 14)
  • Start at 156, what number is 30 less? (126) What number sentence represents these moves? (Possible response: 156 − 10 − 10 − 10 = 126; 156 − 30 = 126)
  • What number is 50 less than 168? (118) What number sentence represents these moves? (Possible response: 168 − 50 = 118)
  • What number is 60 less than 72? (12) What number sentence represents these moves? (Possible response: 72 − 60 = 12)

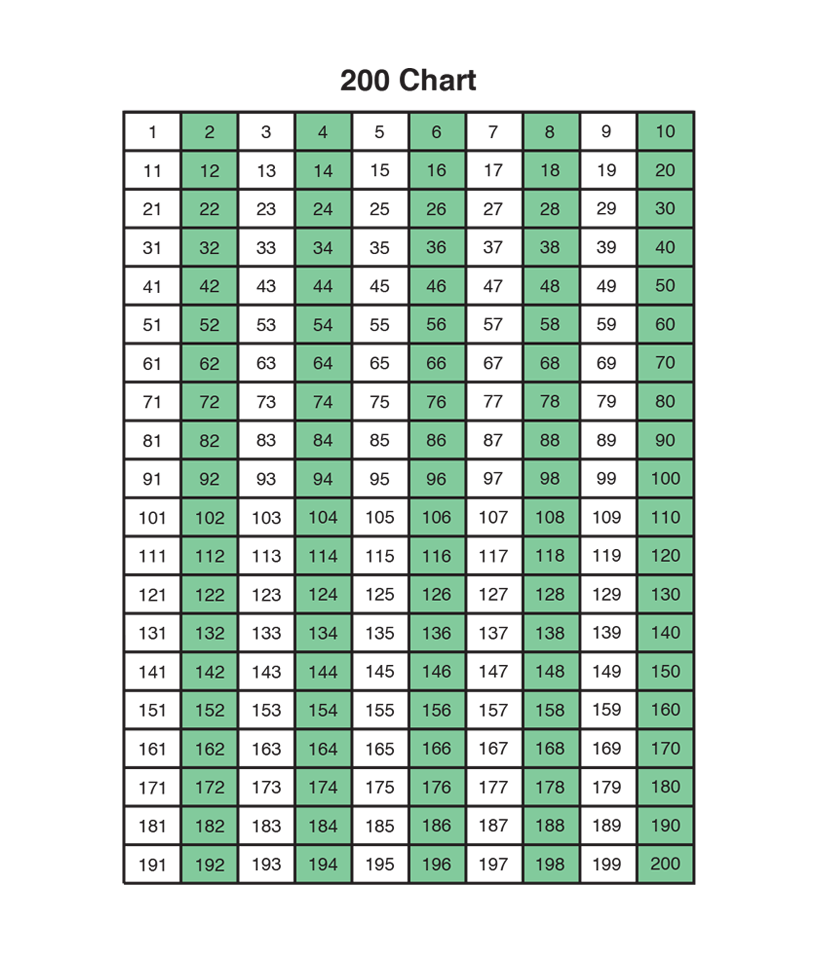
Skip Count by Twos. Ask students to use the second copy of the 200 Chart in the Student Activity Book to start at zero and skip count by two. Instruct students to color these numbers green. Use a new display of the 200 Chart to do the same. See Figure 2.

  • Do you see any patterns on the chart? (Possible responses: There are five columns colored green: every other column, under the numbers 2, 4, 6, 8, 10.)
  • What do we call these numbers? (even numbers)
  • Will you cover [52] if you continue counting? (yes)
  • How about [176]? (yes) [180]? (yes) [185]? (no)
  • How do you know? (Possible responses: the even numbers are in columns; the last digit of an even number is either 2, 4, 6, 8, or 0)
  • Name some other even numbers. (Responses will vary. Possible responses: 54, 68, 92)
  • Work with your partner to compare the 200 Chart you colored yellow and the 200 Chart you colored green. Which numbers are colored on both charts? (the numbers that we colored yellow and circled red; the numbers we colored when we skip counted by ten)

Patterns in Even and Odd on the 200 Chart. Some possible observations about even and odd numbers:

  • There are the same number of green columns and non-green columns.
  • To get from an even number to an odd number you can add or subtract one.
  • To get from an odd number to an even number you can add or subtract one.
  • There are about the same number of even numbers and odd numbers since you can pair one even and one odd number together.
Students will likely not make all of these observations. Discuss the observations that students make.

Use Cubes to Model Even and Odd. Comparisons between multiples of twos, fives, and tens lead to a discussion of even and odd numbers. To review the terms even and odd, ask students to take a handful of cubes and connect them in groups of two. If there is one left over, the number of cubes is odd. For example, if a student grabs thirteen cubes, he or she can make six pairs of two with one leftover. Thirteen is an odd number. If a student grabs twelve cubes, he or she can make six pairs of two with no leftovers. Twelve is an even number. Ask students to determine whether their handful of cubes is even or odd. If they have an odd number, ask them to raise their hands. List these numbers on the board and label them “odd numbers.”

As an alternative to using cubes to help students visualize “even” and “odd,” have groups of students come to the front of the class and pair off. They can easily see that if there is a student without a partner, the total number of students is an odd number, and if all have a partner, that total is an even number.

  • How do you know your number is odd? (Possible response: I looked at my 200 Chart and my number is not colored green. Or, I put the cubes in pairs and I have one leftover cube.)
  • Were any of the odd numbers of cubes colored in on the 200 Chart? (No, the odd numbers were not colored on the chart.)
  • Which of the numbers are colored green on the
    200 Chart?
    (the even numbers)

Repeat this with students who have an even number of cubes.

  • How do you know your number is even? (Possible response: The number of cubes in my handful is colored green on the 200 Chart, and when I pair the cubes up there are no single cubes.)

Students should recognize that all the even numbers are colored green on the chart. Ask students to discuss any patterns with the even and odd numbers that they see on the chart. See the Content Note.

  • When skip counting by twos, will you always land on an even number? (Answers will vary.)
  • Start at 5 and skip count by twos to 25. (5, 7, 9 ... 23, 25) Did you land on an even or an odd
    number?
    (odd)
  • Start at 29 and skip count by twos to 59. (29, 31,
    33 ... 57, 59)
  • Start at 131 and skip count by twos to 171. (131, 133, 135 ... 169, 171) Did we land on an even or an odd number? (odd)
  • Now what do you think? When skip counting by twos will you always land on an even number? Explain your thinking. (Possible response: No, because if you start on an odd number you will always land on an odd number.)

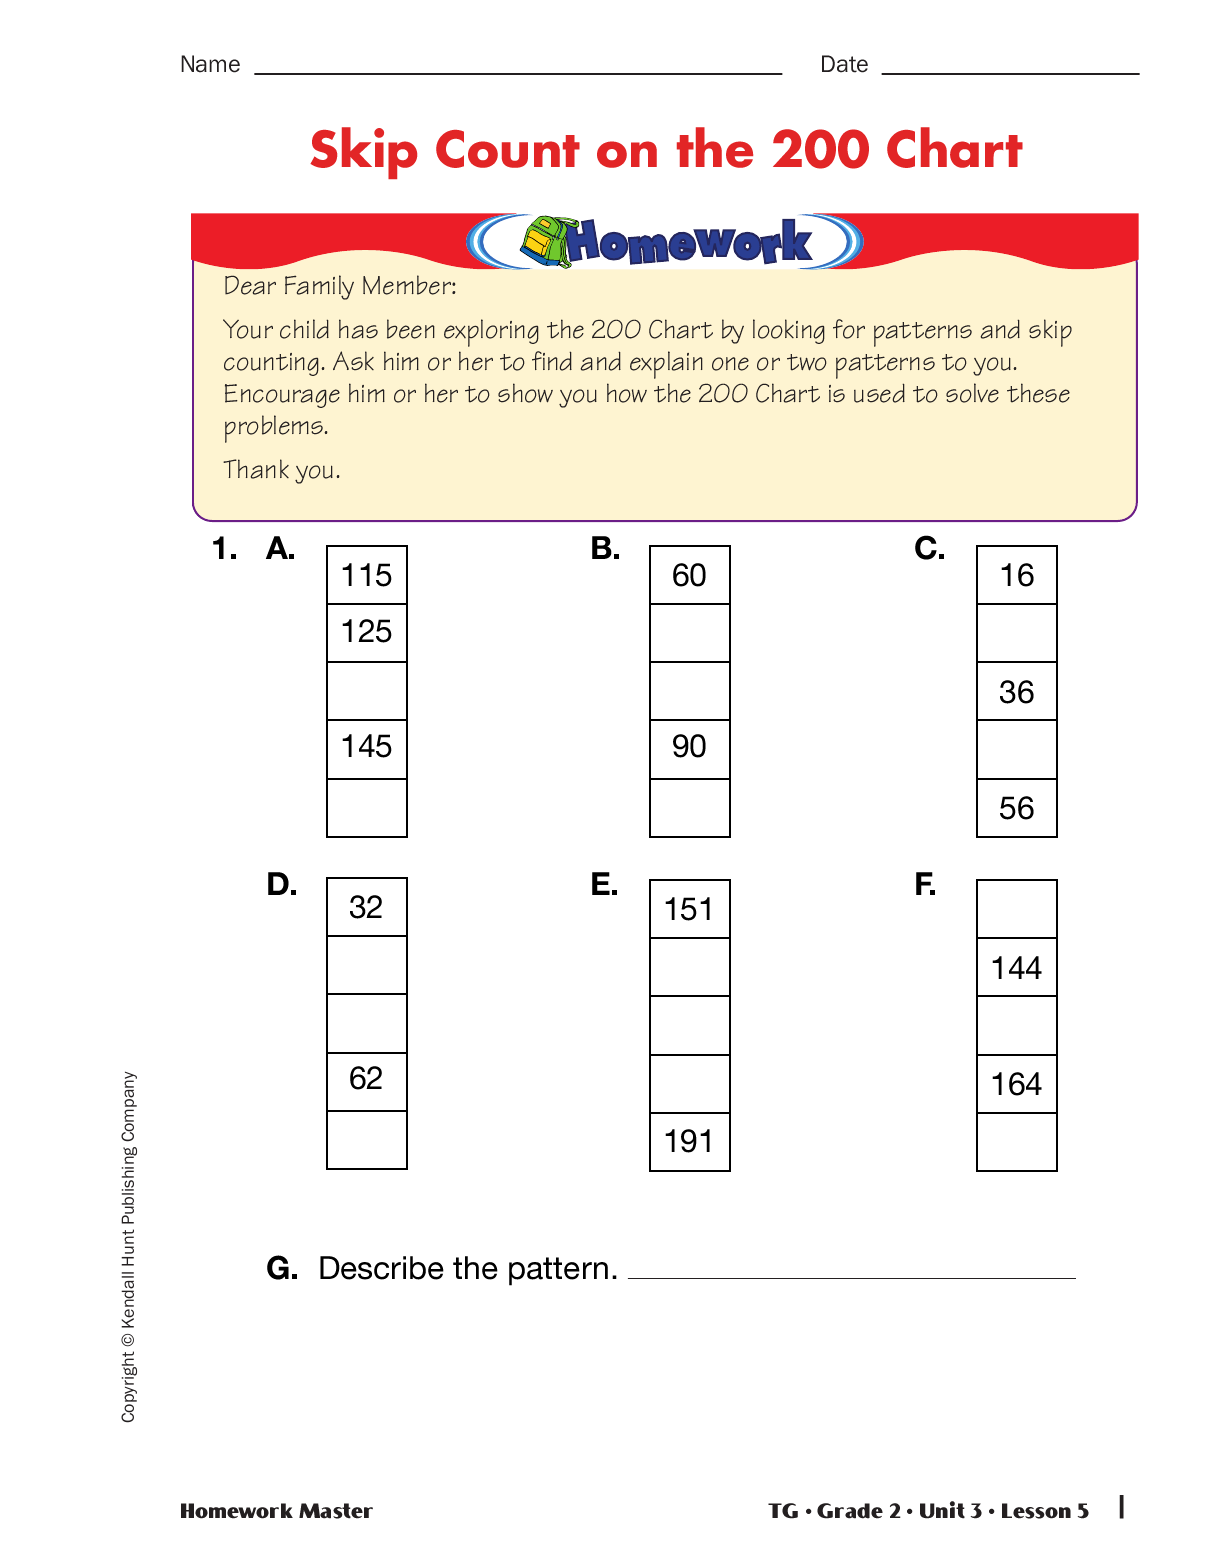
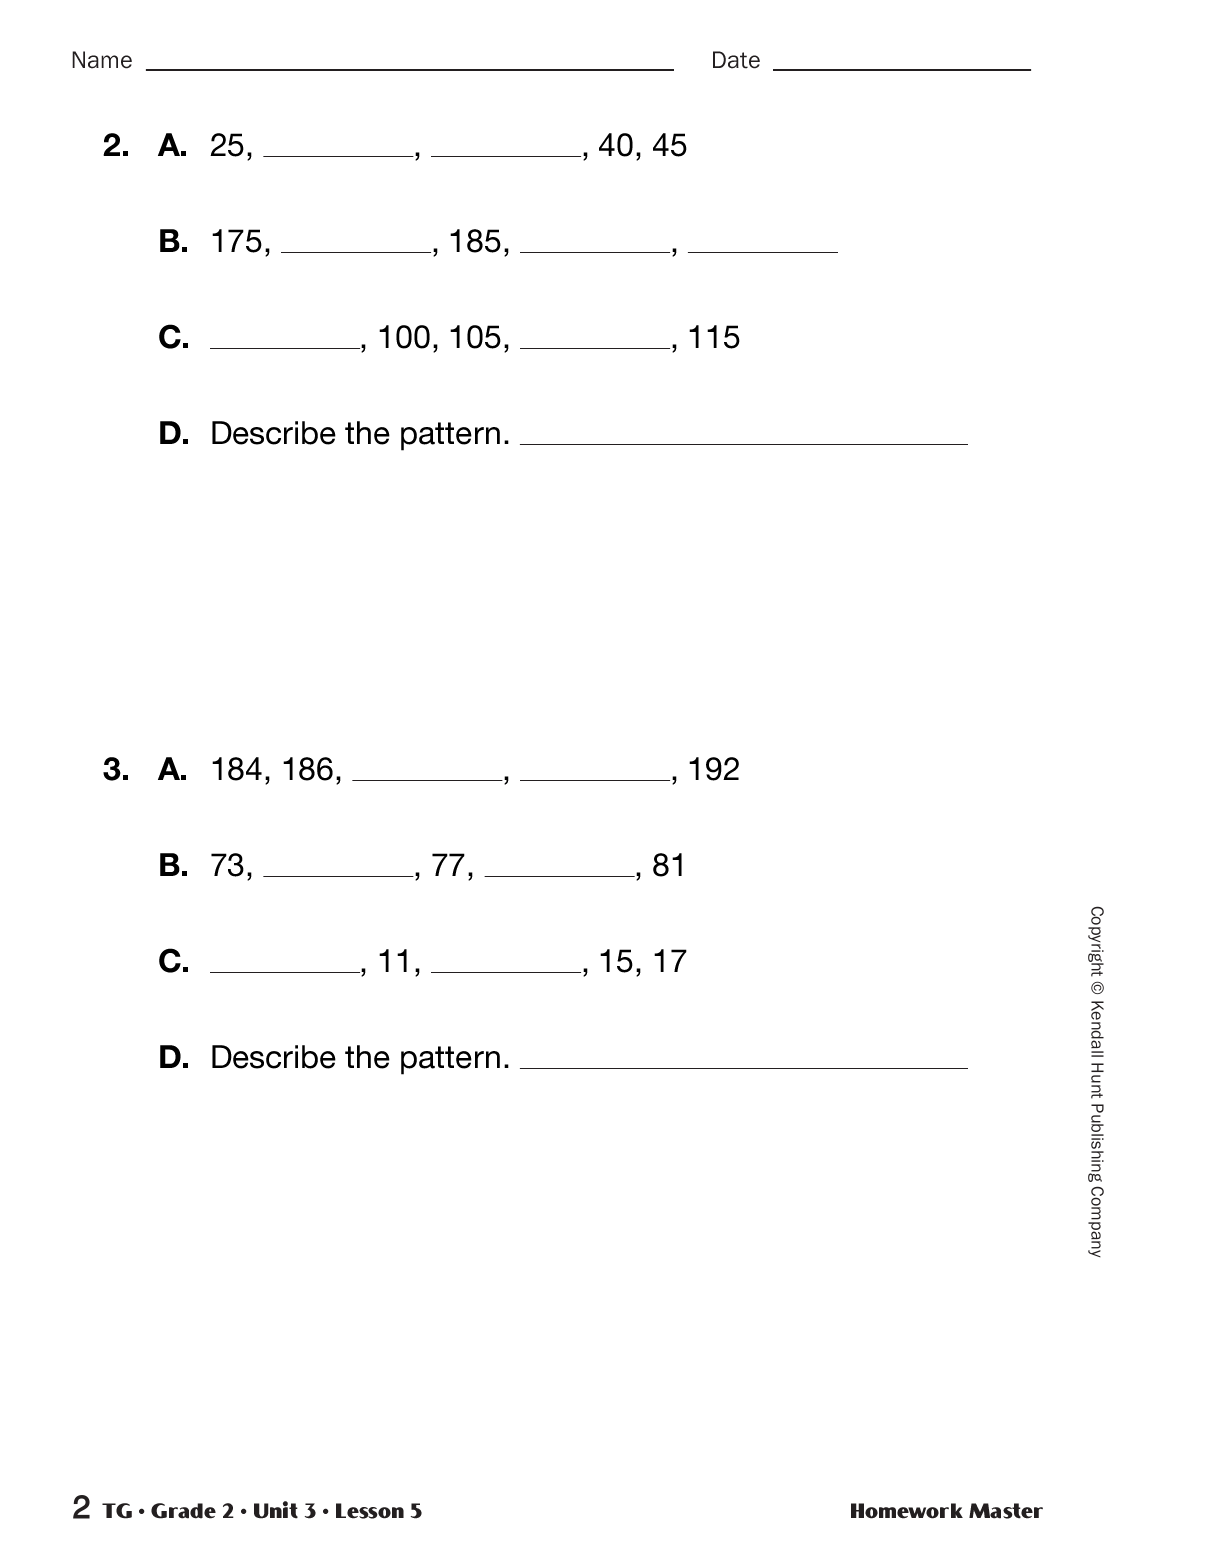
Assign Skip Count on the 200 Chart Homework Master after
Part 1. Students will practice using patterns to skip count by tens, fives, and twos on the 200 Chart.

X
SG_Mini
+
X
SG_Mini
+
200 Chart showing patterns of fives and tens
X
+
200 Chart with all the even numbers colored green
X
+