


Our Favorite: A Data Collection Lab
Est. Class Sessions: 2
In this teacher-guided lab, students use the TIMS Laboratory Method to graph and explore data collected in their classroom about their favorite lunches. They use strategies to solve addition and subtraction problems based on the data.
Content in this Lesson
- Representing addition and subtraction using number sentences [E3].
- Solving subtraction problems using counting strategies [E5].
- Using mental math strategies and reasoning strategies (e.g., using doubles, using ten, making ten, reasoning from known facts) to solve addition and subtraction problems within 20 [E6].
- Solving word problems (e.g., join, separate/take away, part-whole, compare) involving two whole numbers with a sum within 100 [E7].
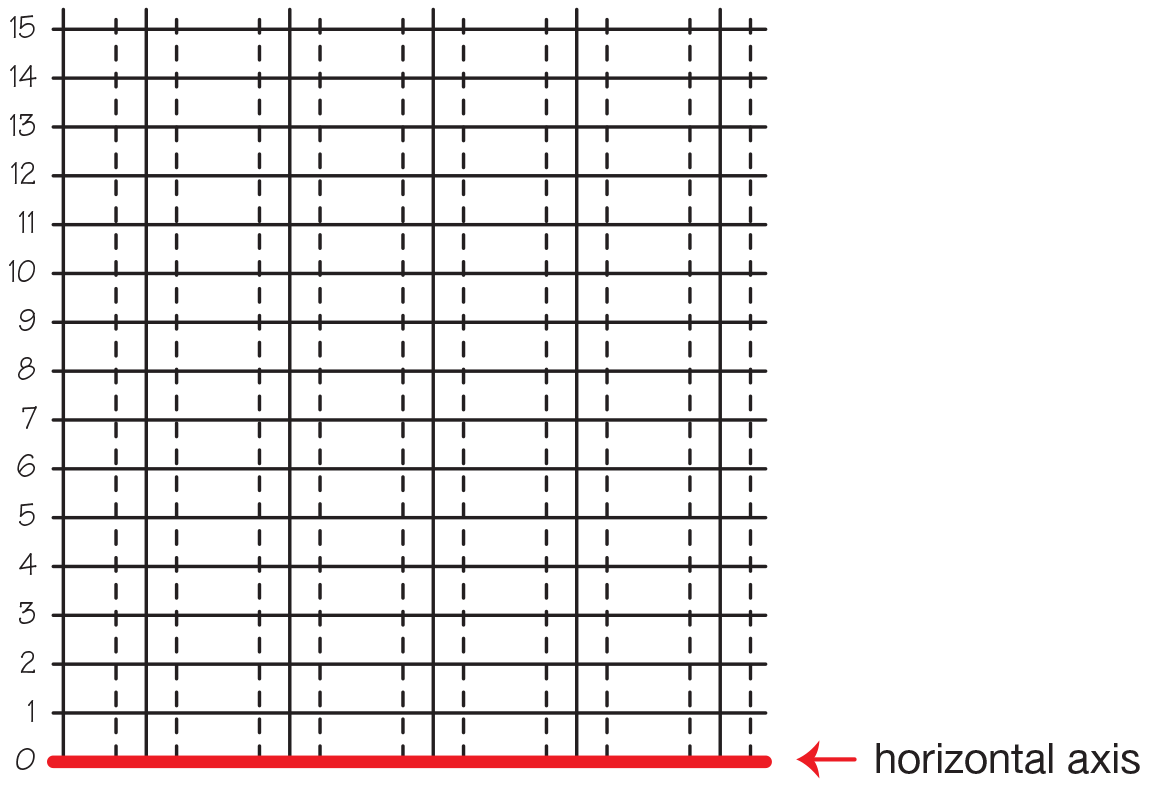
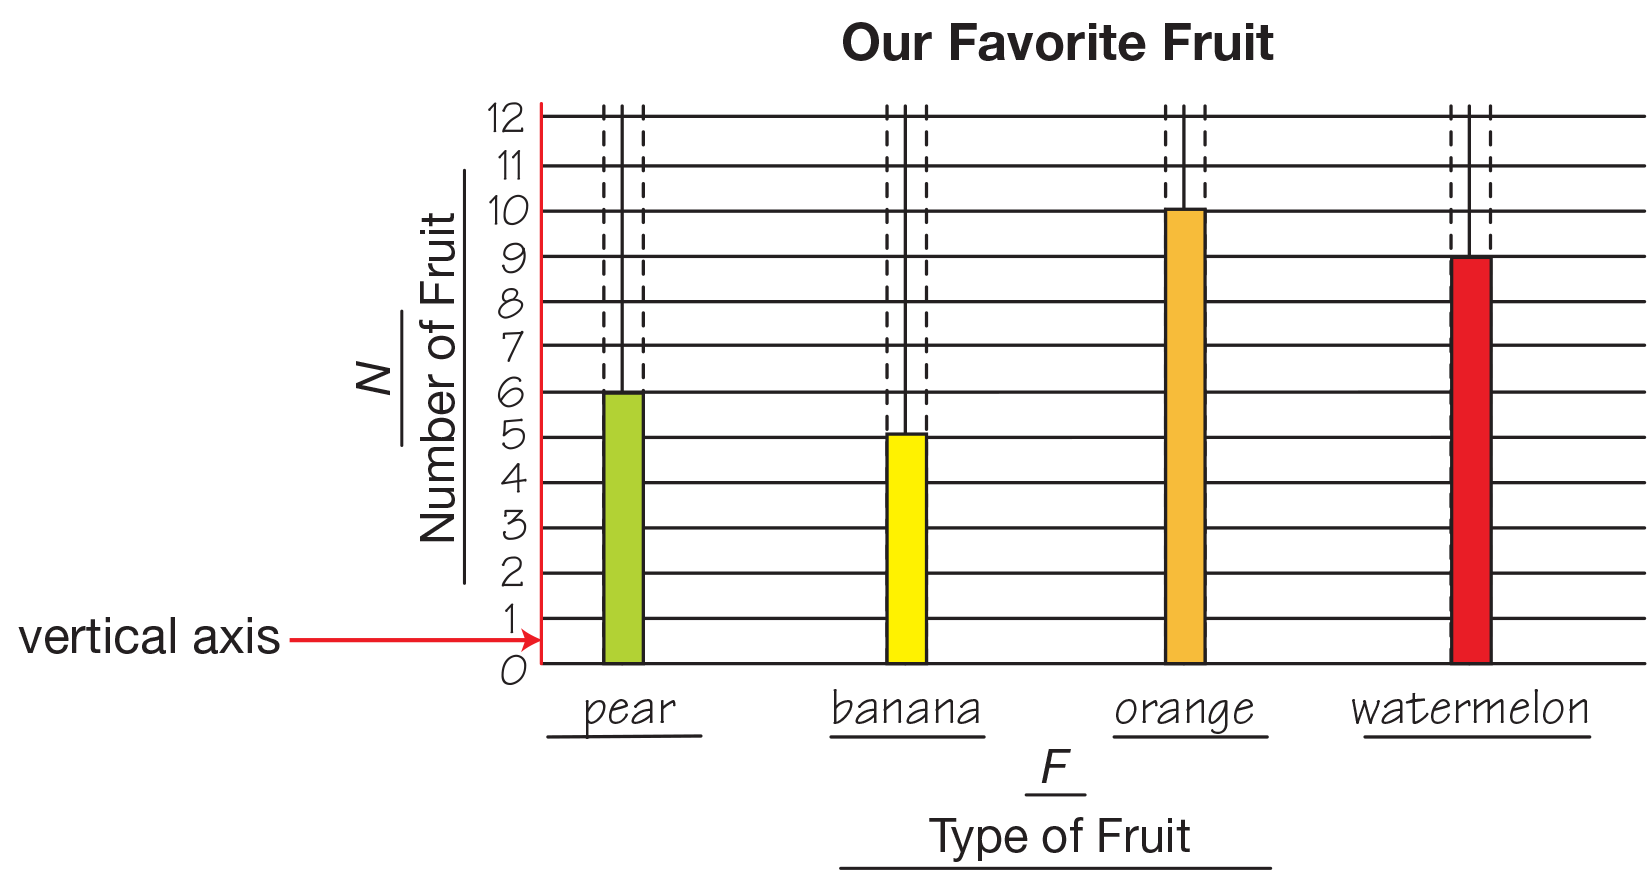
- Drawing a bar graph from a data table [E8].
- Reading a bar graph or table to find information about a data set [E9].
Daily Practice and Problems K–N

Materials for Students
| Daily Practice and Problems | Lesson | Homework | Assessment | ||
|---|---|---|---|---|---|
Student Books |
Student Activity Book |
|
|
|
|
Teacher Resources |
Teacher Guide - digital |
|
Supplies for Students
desk number line (0–100)
20 connecting cubes
square self-adhesive note
Materials for the Teacher
Display of Our Favorite _________ table on the Our Favorite Lab (Student Activity Book) Page 122
Display of Our Favorite _________ graph on the Our Favorite Lab (Student Activity Book) Page 123
Display of Mrs. Dawson’s Class (Student Activity Book) Page 125
Unit 3 Assessment Record
Math Facts Class Record
chart paper
Materials Preparation
Prepare Our Favorite Picture Graph. Make a table on chart paper or the board. See Figure 1. The table should be large enough to fit several square self-adhesive notes and 4–6 categories, depending on what students decide to investigate. Place a self-adhesive note below the chart as shown below. The example note shows the student’s name and his or her favorite sandwich.
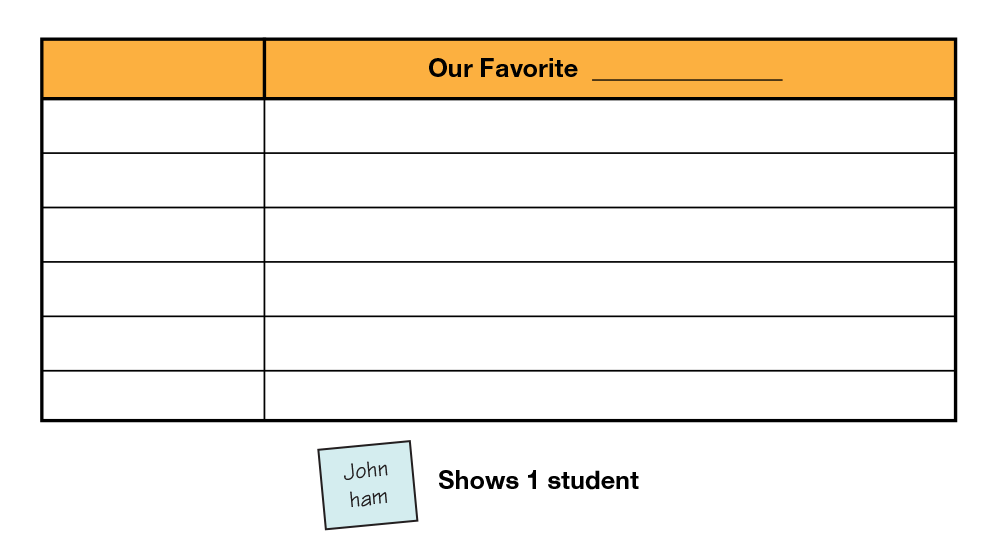
Figure 1: Our Favorite Picture Graph
Assessment in this Lesson
| ASSESSMENT | EXPECTATION ASSESSED |
|---|---|
|
Mr. Hart’s Class with Feedback Box Student Activity Book Pages 127–129 |
|
|
DPP Item L Fact Families Teacher Guide - digital |
|