


Using Estimation
Est. Class Sessions: 2–3Developing the Lesson
Part 1: Mystery Jars
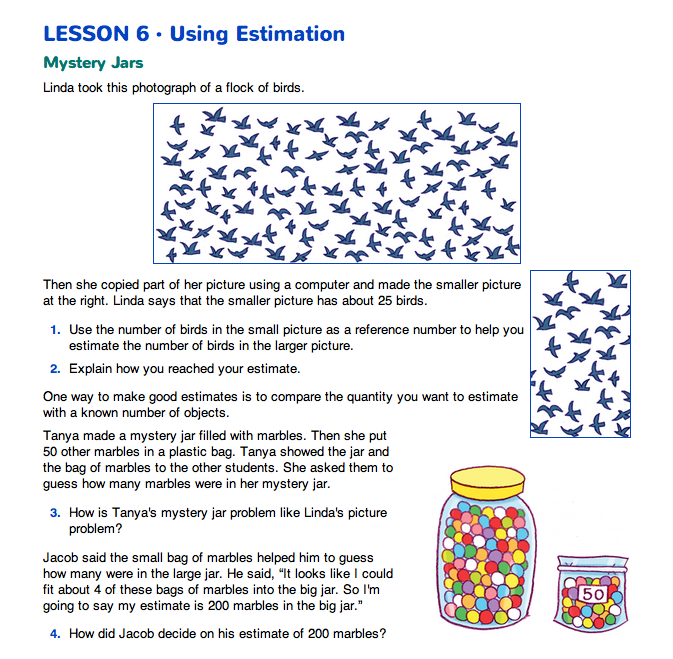
Discuss Estimation. To begin the activity, discuss the opening example and Questions 1–2 in the Mystery Jars section in the Student Guide. Students must estimate the number of birds in a larger picture when given the number of birds in a smaller picture. Give students a few minutes to discuss with a partner how to make an estimate. Have students describe their estimation strategies. Highlight strategies that include estimating the number of times the small picture will fit into the larger picture (about 5 times), then multiplying this estimate by the number of animals in the smaller picture (about 25 birds). Since 5 × 25 = 125 birds, 125 birds is a good estimate. Point out that a similar method is used to estimate the size of a crowd at concerts, sports events, and political rallies.
Ask:
Read and discuss Questions 3–4 in the Mystery Jars section of the Student Guide.

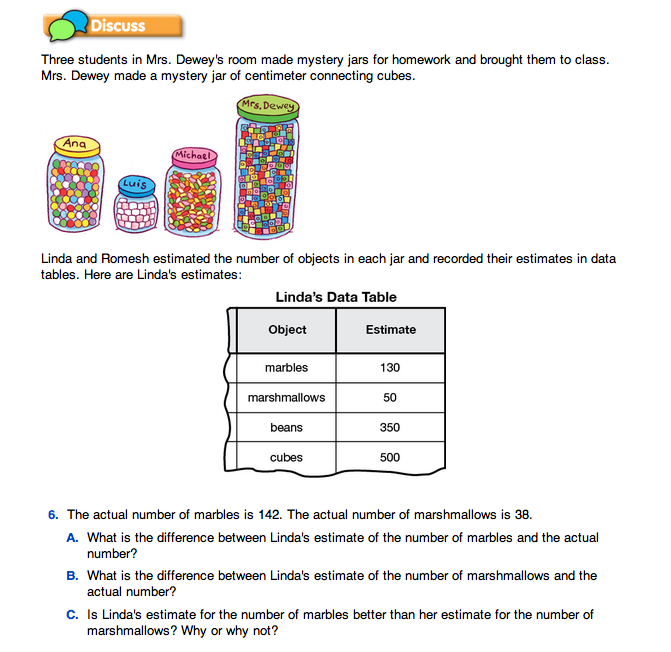
Use Estimation. To help students think through the estimation process, choose one of the prepared mystery jars. See Materials Preparation. Ask students to estimate the number of objects in the jar.
Show the class the bag containing the reference number of objects that corresponds with the mystery jar.
For example, if the reference bag has 100 objects, say:
Discuss possible estimation strategies. Highlight strategies that utilize the reference bags and involve the rudiments of proportional reasoning. Then tell students that they will estimate the number of objects in each of the mystery jars. Have students begin a data table by drawing a Three-Column Data Table as shown in Figure 1.
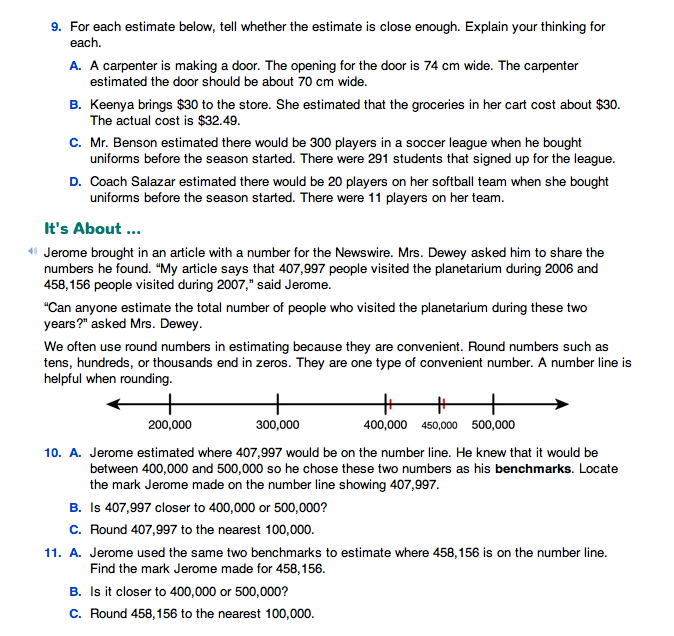
Make Estimates. Place the other prepared mystery jars at various stations throughout the room. Allow students to circulate throughout the room and make their estimates. They should identify each jar by number in their data tables and fill in the type of object and their estimates.
Analyze Estimates. When students have finished making their estimates, open the lids and tell the exact number of objects in each jar. Record the actual quantities on the board or another display. The following discussion prompts use the estimates in the data table in Figure 1 as examples. Use the prompts to help guide a discussion on what it means to be close.
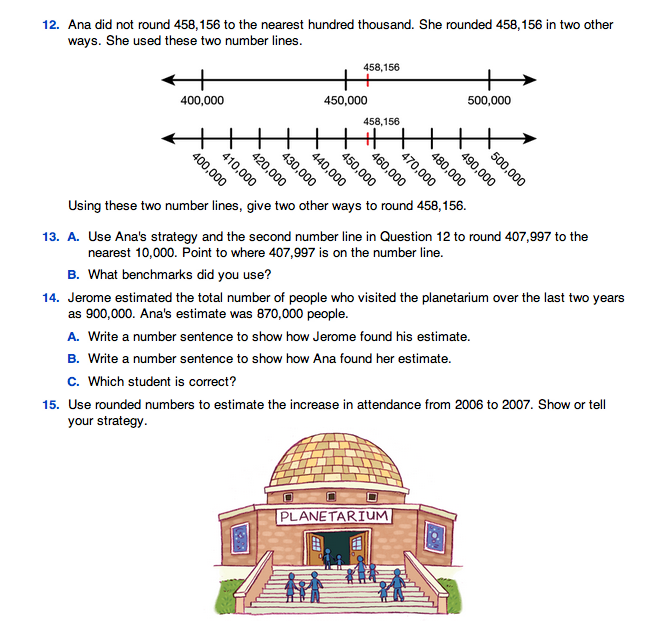
Open the larger jar that contains the same objects as a smaller jar. The following discussion prompts are based on Jar 2 in Figure 1. Tell the class the actual number of objects in the larger jar.
Ask:
If you have the space on the board, draw a number line that encompasses at least 100 units on either side of the actual number of objects in the jar. Insert appropriate benchmarks. Mark the actual number of objects that are in the jar on the number line. Have students place their estimates on the number line. See Figure 2. When the estimates have all been inserted into the number line, initiate a discussion with students about the range shown.
Ask:
Analyze with the class whether the estimates cluster around the actual number of beans in Jar 2 or if they are more spread out. If there is an identifiable cluster, draw a circle or lines separating the cluster from those farther away. See Figure 2. Suggest that the estimates within the cluster can be considered close enough and those outside the cluster not close enough.
Using the hypothetical estimates listed in Figure 2, it may be reasonable to draw lines to identify the estimates 255 through 295 beans as the range of close estimates and those outside of that range as not close enough. Both estimates are 20 units away from the actual number and for both numbers there is a gap before the next closest estimate.
If there has been no identifiable cluster around the exact number, have the students discuss where to draw the lines between the estimates they think are close enough and those not close enough.
Choose the smaller jar filled with the same objects and tell the class the actual number of objects in the jar. For the purposes of this discussion, we'll refer to Jar 3 listed in the table in Figure 1. Conduct the same discussion about this jar as for the larger jar. Draw another number line and insert the students' estimates in order, along with the actual number of objects in that jar.
Ask:
At first students may choose the same range of values as they did for the larger jar. For example, if there are actually 25 beans in the jar, students may say that good estimates may also be within about 20 of the exact number. However, other students may feel that estimates as low as 5 and as high as 45 beans are not good estimates.
Ask:
It is clear that we cannot use a difference of 20 objects as our standard for both Jars 2 and 3. Estimates within 20 beans of 275 beans, such as 295 beans, can be considered good estimates. Using the same range, however, for the number of beans in Jar 3 is not appropriate. Estimates as low as 5 and as high as 45 beans should not be considered good estimates when the actual number is 25 beans.
Ask questions such as:
How Close is Close Enough? Have students work in pairs to discuss and answer Questions 5–9 in the Student Guide. Alternatively, Questions 5–9 can be assigned as homework after Part 1.
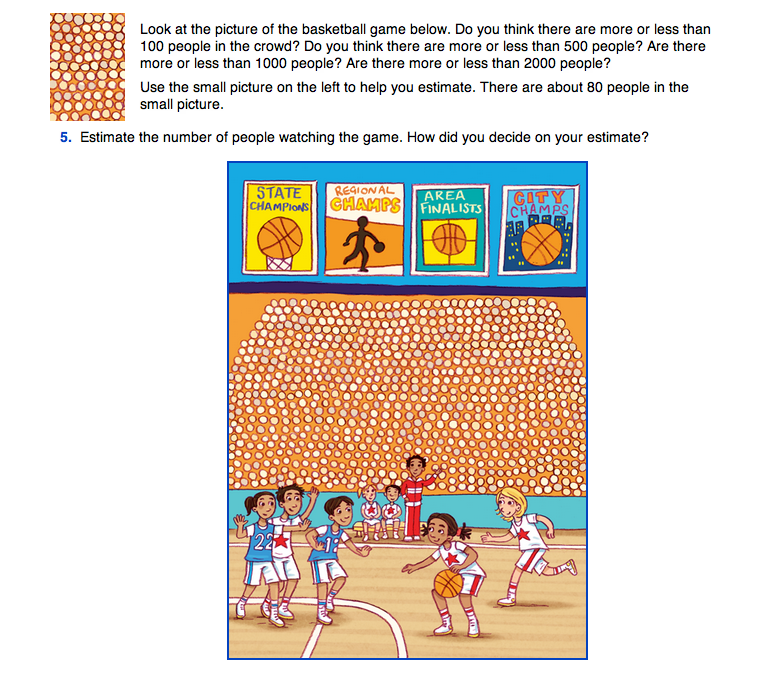
Question 5 asks students to estimate the number of people in the crowd watching a basketball game. Encourage them to use the number of people in the small picture as a reference number. As students report their estimates to the class, encourage them to explain their estimation strategies. How can we know if our estimate is close enough? In this case we may have to be satisfied with knowing that we have used good strategies to make the estimates since it would be difficult to count each person. There are approximately 900 people in the picture.
In Questions 6–8, students review the notion of relative error by analyzing the estimations that Linda and Romesh make for the mystery jars in their classroom. Provide students with an opportunity to answer these questions with a partner and then use the following questions help to guide the discussion:
Ask:
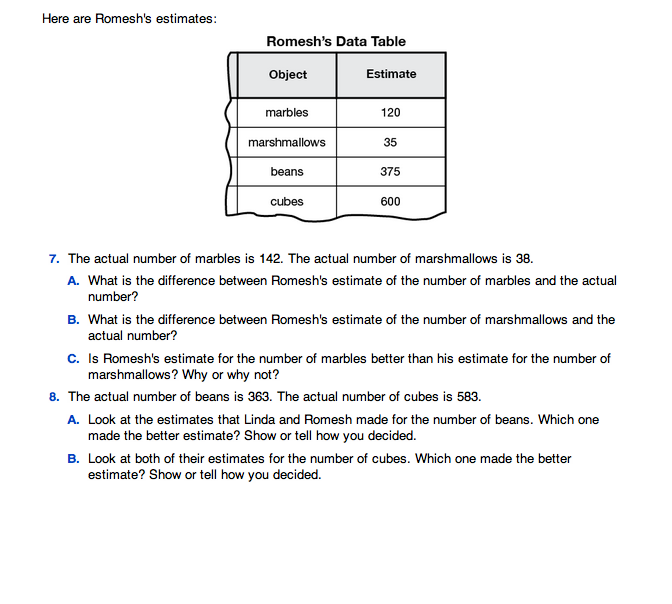
In Question 8A, students should see that both Linda and Romesh made reasonable estimates. Linda's estimate is 13 away and Romesh's estimate is 12 away but both are reasonable. In Question 8B, Romesh's estimate is closer to the actual number.
Question 9 asks students to determine whether or not given estimates are reasonable. Students should consider the context for each estimate. In Question 9A, the estimate is too low to be reasonable. In this situation, the estimate needs to be very close (perhaps within one-half of a centimeter of the measured width of the opening, but not greater than the width of the opening) for the door to fit properly. In Question 9B, the estimate is also too low. Keenya will not have enough money to pay for the actual cost of the groceries. Although the estimates in Questions 9C and 9D are both within 9 of the actual number, their reasonableness has to do with the relative size of the error compared with the estimated number. The difference in Question 9C is small compared to the actual number, so the estimate is more reasonable than in Question 9D, where the error is large compared to the actual number.