


Workshop: Large Numbers
Est. Class Sessions: 1–2Developing the Lesson
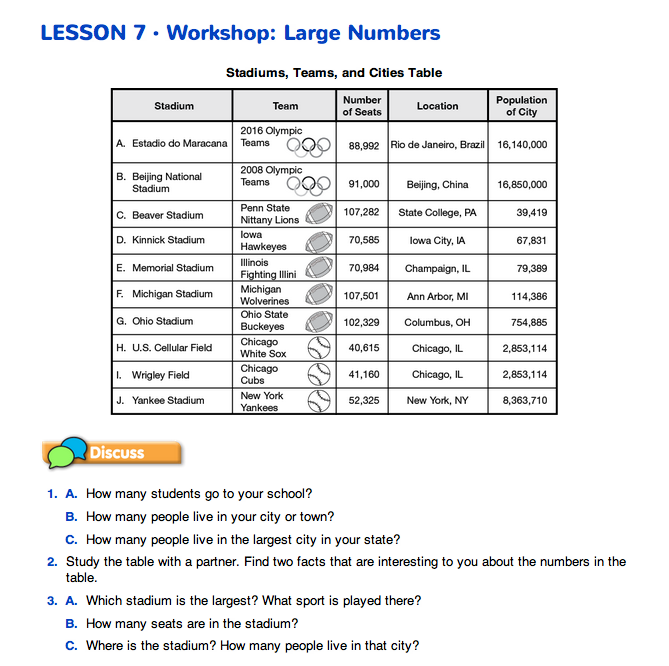
Part 1: Introducing the Stadiums, Teams, and Cities Table
Begin the lesson with a class discussion of Question 1 on the Workshop: Large Numbers pages in the Student Guide. Question 1 asks for data about the number of students in the school and the populations of towns and cities that the students know. Discussing data about the number of seats in the school auditorium and a local stadium will help students make connections between the numbers they will use in the lesson. It provides an opportunity for students to practice reading large numbers and for you to assess their progress with this skill.
Display the numbers that you or your students have gathered about your community on the board. (See Before the Lesson for suggestions.) Figure 1 shows sample data.
Ask students to read the numbers out loud.
Then, ask questions similar to the following:
Display the Stadiums, Teams, and Cities Table Master for the class. Have students turn to the table on the Workshop: Large Numbers page in the Student Guide. Ask them to answer Question 2. Students work with partners to find interesting facts that are in the table and report them to the class. Talk with groups as they discuss the table.
If they are hesitant to find something that interests them, ask:
Have students report their interesting facts to the rest of the class. Then, use Questions 3 and 4 to continue to familiarize students with the table and check to see that students can read and compare the large numbers in the table.
Question 5 reminds students that the population figures in the table are only estimates. The number of people in a city changes continuously as babies are born, people die, and families move in and out.