


Doubles
Est. Class Sessions: 2–3Developing the Lesson
Part 1. Doubling
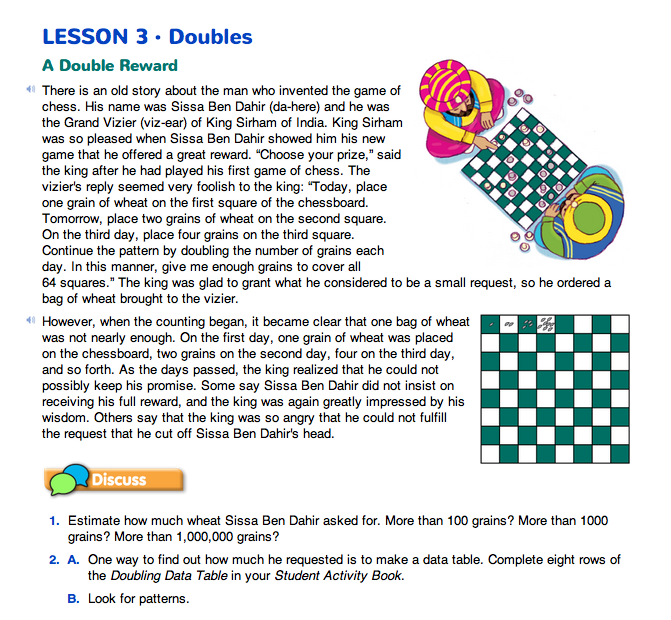
A Double Reward. Introduce the lesson by reading the Doubles pages in the Student Guide. These pages tell the story of Sissa Ben Dahir of India, who invented the game of chess. As a reward, he requested one grain of wheat on the first square of the chessboard on the first day, two grains on the second square on the second day, four grains on the third day, eight grains on the fourth—doubling the quantity each day until all 64 squares had been covered.

Question 1 asks students to estimate how much wheat the vizier will receive if his request is granted. To help students estimate, ask a student to act out the story using the display of the Chessboard Master and beans or other small markers to serve as grains of wheat. This problem will be explored in several ways throughout the unit. A reasonable guess is all that is asked for at this point.
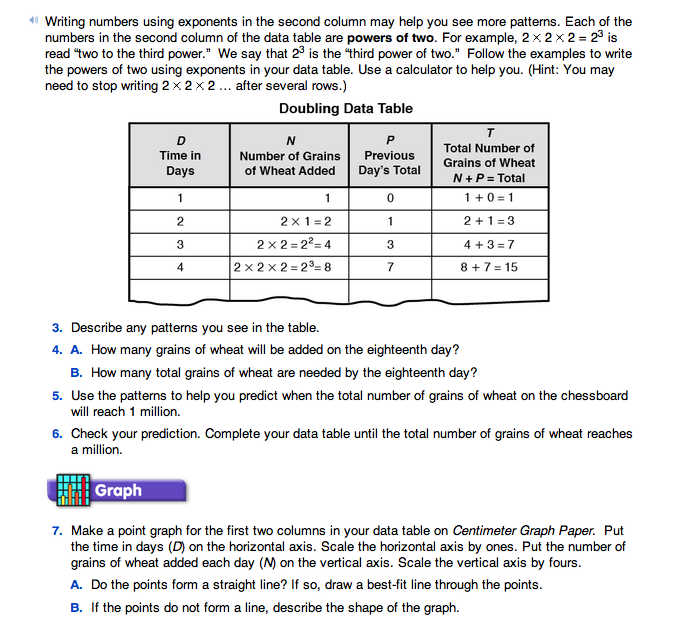
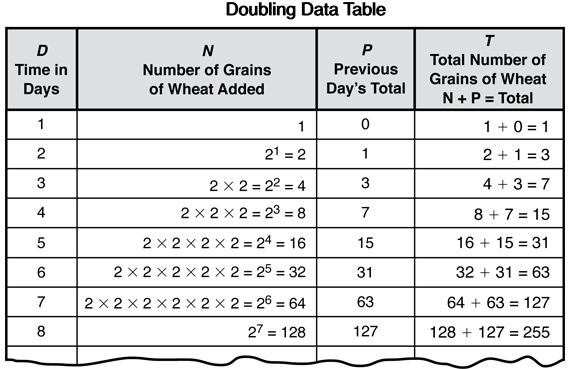
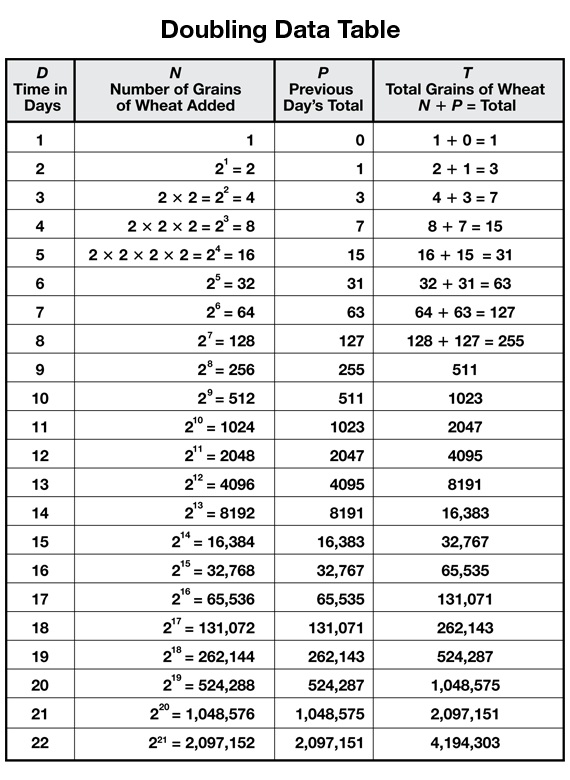
Question 2 asks students to complete 8 rows on a doubling data table and to look for patterns. Help them get started by filling in the first few rows as a class. Match the data in the table to the “grains of wheat” on the display of the Chessboard Master. Use a sheet of poster paper or a display of the Doubling Data Table page from the Student Activity Book. Point out to students that the numbers in the second column are called powers of two because they are the products of two multiplied by itself a certain number of times. Remind them of their work with exponents in Unit 3. Figure 2 shows a data table completed for eight days.
Question 3 asks students to describe the patterns they see. Encourage students to look across the rows as well as down the columns. Possible patterns that the students may see:
- The number of grains of wheat added (N) doubles each day.
- The Previous Day's Total (P) is always an odd number.
- The total number of grains of wheat (T) is always an odd number.
- The exponent in the second column is one less than the number of days (D).
- The previous day's total (P) in any row is one less than the number added (N).
- The total (T) for any day is one less than the number added for the next day.
- The total number of grains of wheat on a given day is one less than twice the number of grains added. For example, on Day 4 the number of grains of wheat that were added was 8. 8 × 2 − 1 = 15. 15 is the total number of grains in all on Day 4.
When appropriate, ask students to use their patterns to make predictions.
For example, if a student describes the doubling pattern for the number of grains added (N) as in the first bullet above, ask:
See the Sample Dialog taken from an actual classroom discussion for another example.


Visualizing the Doubling Process. After the class has filled in eight rows of the Doubling Data Table, direct their attention to the large paper on which you have marked off a square meter and glued the first 10,000 sq mm Grid. (See Materials Preparation.) Describe how each side of the square meter measures 1000 millimeters. Tell students that each square millimeter stands for one grain of wheat.
Ask:
Have students use their calculators to multiply 1000 times 1000.
Ask:
Color 1,000,000. Label the entire poster-sized sheet the 1,000,000 sq mm Grid. Tell students they will use sharpened colored pencils to color in 1,000,000 square millimeters. To begin, ask a student to color one square millimeter to represent the number of grains of wheat added to the board on Day 1. Ask a second student to color square millimeters to represent the number of grains of wheat added on Day 2 (2 square millimeters). Ask a third student to color square millimeters to represent the grains of wheat added on Day 3 (4 square millimeters). Have students start coloring in the upper left corner and color across rows, coloring in consecutive squares. Continue this procedure until eight students have filled in the number of grains of wheat added (N) through Day 8.
Continue the Table. Students can use the patterns and their calculators to answer Question 4 on the Doubles pages in the Student Guide. Or, students can compute using the table until Day 18. The number of grains of wheat added on the eighteenth day is 217 or 131,072 and the total number is 2 × 131,072 − 1 = 262,143. Ask volunteers to continue filling in the grid for the first 18 rows of the table. At this point, twenty-six 10,000 sq mm Grids will be colored in fully (26 × 10,000 = 260,000) as well as part of the twenty-seventh grid. See Figure 3. As each 10,000 square millimeter grid gets filled up, glue a new one to the page. As students find and record ever-increasing doubles on the Doubling Data Table, select individual students to color that number of square millimeters on the 1,000,000 sq mm Grid.
Say:
One way to think about this is that each 10,000 sq mm grid measures 10 cm or 100 mm on a side as shown in Figure 4. This means that there are 100 rows, each with 100 sq mm. To color in 100 sq mm, a student will color a full row of the 10,000 sq mm grid. On the other hand, the 10,000 sq mm grid is also divided into square centimeters. Each square centimeter is made up of 100 sq mm (10 mm by 10 mm), so to color in 100 sq mm, students can also choose to color one square centimeter. Students can count by 100s as they color. When they color in the larger numbers, they should switch to crayons.
As you ask students to color, ask questions such as:
Question 5 asks students to predict when the total number of grains of wheat on the chessboard will reach 1,000,000 grains. Note that this is the same prediction as how many students it will take to color in 1,000,000 square millimeters. Students should first make an estimate, then look for patterns in the data and use the data to revise the estimates.
You may wish to restate the problem:
Students should record their predictions on their data tables. Ask students to share their predictions and to explain their thinking. Discuss several different predictions without giving any clues about what will happen.
To check their predictions (Question 6), students can continue filling in their data tables until the total number of grains (T) is greater than 1,000,000 while the class continues filling in the 1,000,000 sq mm Grid. When wheat is added on the twentieth day (D = 20), the total number of grains of wheat (T) will be more than 1,000,000. (When D = 20, N = 219 or 524,288 and T = 1,048,575.) See Figure 3.
Calculators. There are many ways to use a calculator to find 1 + 21 + 22 + 23 + 24. Students should find the exponent key on their calculators: 
![]() . Students might also use the constant,
. Students might also use the constant,  , on their calculators to find number of grains of wheat added each day.
Discussing different strategies and asking students to find more efficient ones will help to highlight the patterns in the problems and table.