


Downhill Racer
Est. Class Sessions: 3–4Summarizing the Lesson
Explore a Similar Situation. Assign Questions 16–21. Students may work on these questions individually or in groups, as class work or as homework. Students will need calculators and a copy of the Centimeter Graph Paper Master. Use these questions to review and then discuss many of the concepts related to data analysis and algebra developed in Grade 4.
The problems focus on a context similar to the Downhill Racer lab. In this new context, described in Question 16, the height of the ramp stays the same and the starting point on the ramp changes. Compare the variables in this new context to those in the Downhill Racer lab students just completed.
Ask:
Have students make conjectures about what they would find out by making any one of these variables the manipulated variable.

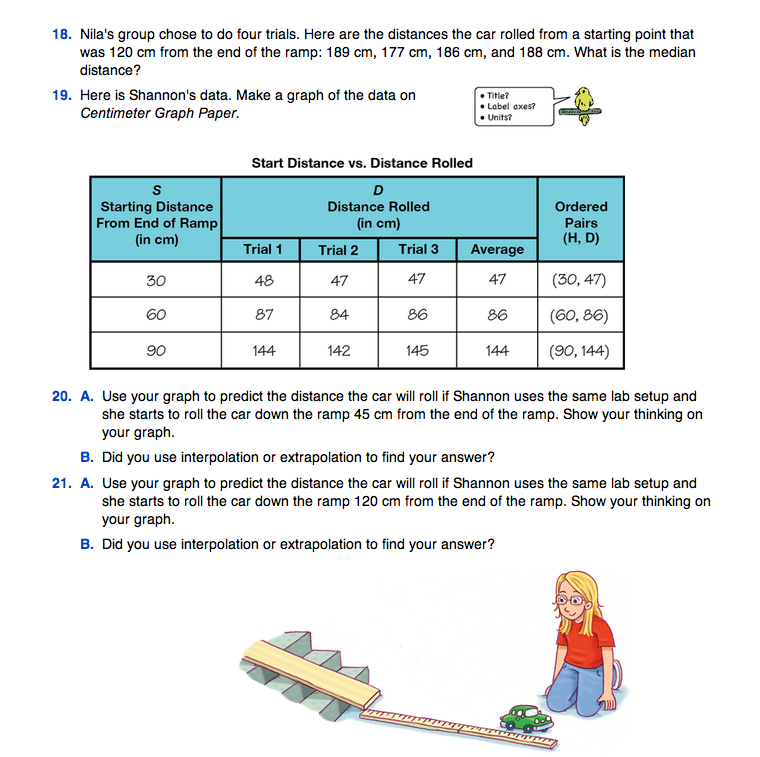
Questions 17 and 18 ask students to find the medians of a given set of data. Students graph a set of data and use the graph to make predictions using interpolation and extrapolation in Questions 19–21.
Analyze Roberto's Data. Assign the Roberto's Data Assessment Master in the Teacher Guide. Students are given sample data to graph and analyze for the Downhill Racer lab. Students will need a ruler and a copy of the Centimeter Graph Paper Master to complete the assessment.
In Questions 5–9, students interpret their graphs and predict patterns when comparing data sets. Students should show and label dashed lines and arrows on their graph for Questions 5–8. In Question 9, students are asked to predict how Keenya's line graph would differ from Roberto's and to explain how they arrived at their prediction. Refer students to Math Practices Expectation 5 on the Math Practices page in the Student Guide Reference section.