


Downhill Racer
Est. Class Sessions: 3–4Developing the Lesson
Part 4. Analyze the Results
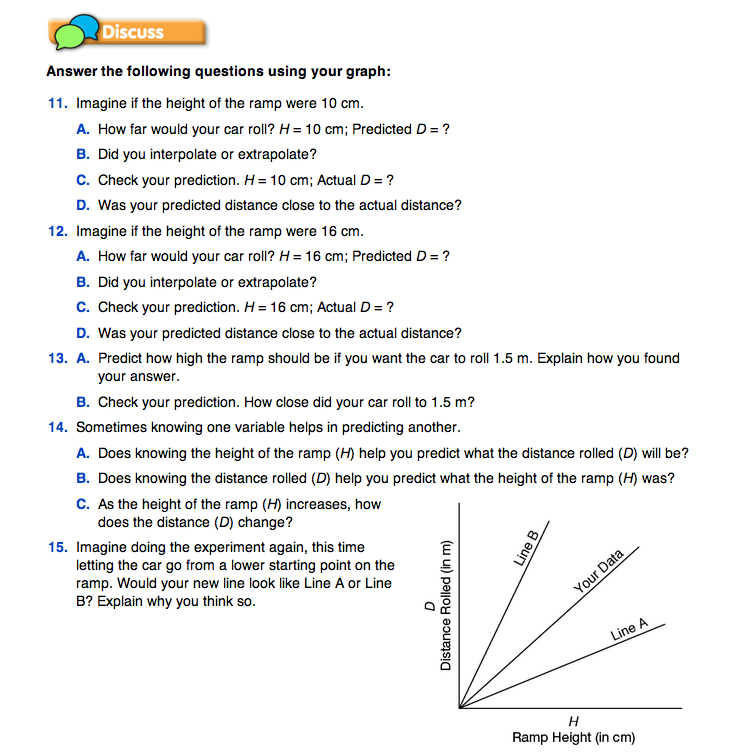
Make and Check Predictions. Ask students to work with their group to answer Questions 11–13. In these questions students use the graph to interpolate, extrapolate and make predictions. Remind students that estimating data points that lie within the data is interpolating. Predicting data points that lie beyond the range of the data is extrapolating. Students should mark their predictions on the graph using dashed lines and arrows, as shown in Figure 6. They should then check their predictions experimentally. For students' predictions to be close, the experimental setups must be the same—all variables must be held fixed except the height of the ramp. Remind students to use their pictures and notes to be sure their setup is the same.
Help students decide if their predictions are close. Students should understand that “closeness” is relative. The difference between predicted distances and actual measurements can be greater for longer distances than shorter distances. For example, a prediction of 5 m can be considered close if the actual measurement is within 0.5 m. However, a predicted distance of 1 m would not be considered close if the actual distance the car rolled was 0.5 m or 1.5 m, but it would be if the rolling distance were between 0.9 m and 1.1 m.
Describe the Relationship. Ask small groups to discuss and answer Question 14 and then discuss student responses as a class. Students should describe the relationship between ramp height and distance as a positive linear relationship. As the height of the ramp increases, the distance increases.
Tell students to use this relationship to discuss and answer Question 15.
Ask: