


Downhill Racer
Est. Class Sessions: 3–4Developing the Lesson
Part 1. Identify Variables in the Investigation

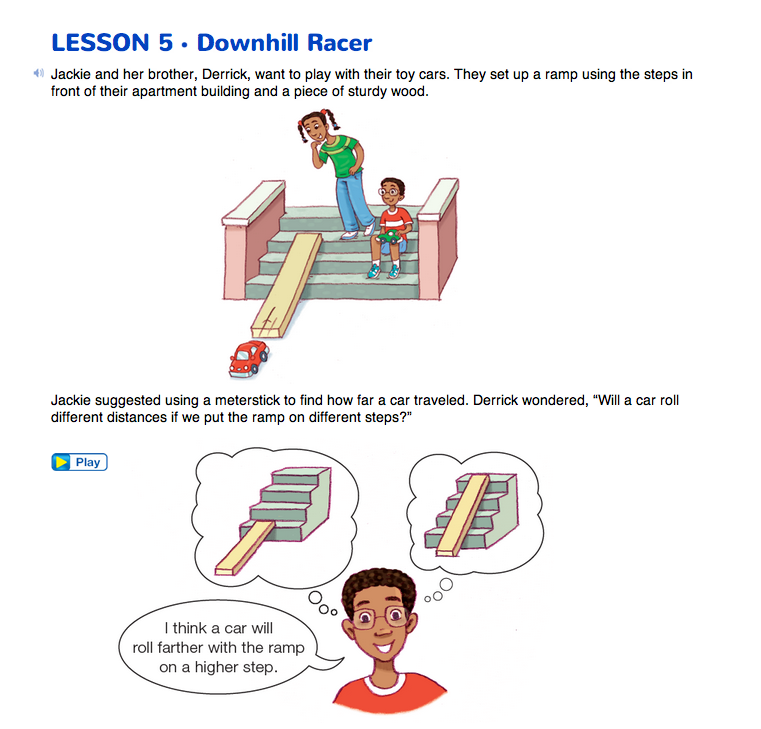
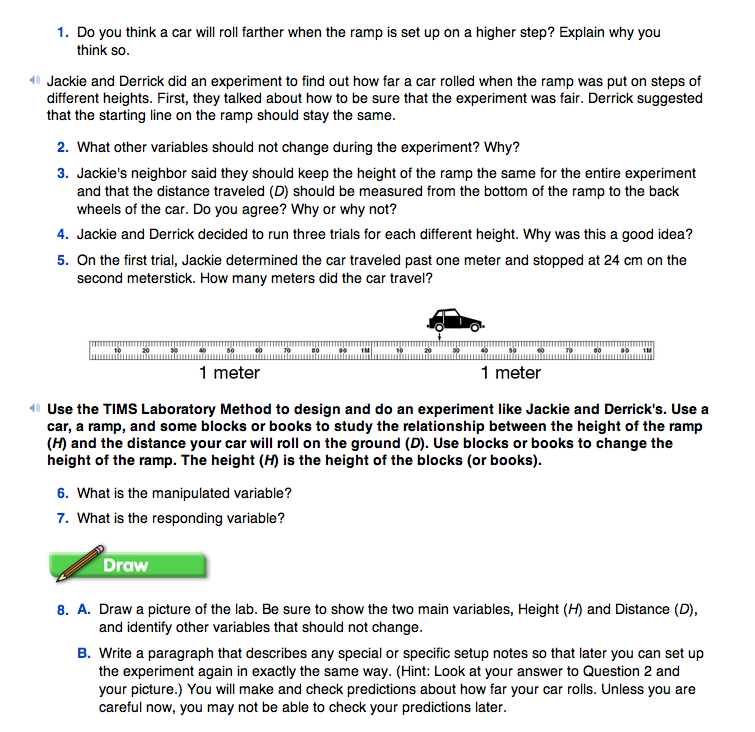
Introduce the Lab. One way to introduce the lab is to set up two ramps, one held up by two blocks or books, the other held up by four blocks or books. See Figure 2. Show students the car that will be rolled down both ramps.
Without rolling the car down the ramp, ask:
Introduce the lab using the Downhill Racer pages in the Student Guide. Explain that instead of using the steps from Jackie's apartment building, the class will use books or blocks to investigate the relationship between the height of a ramp and how far a car rolls.
Identify Fixed Variables. To investigate the effect changing the height has on the distance the car rolls, all other variables involved in the experiment should be held fixed. In planning the experiment, students should discuss these fixed variables (Questions 2 and 3):
- car (Each group should use the same car throughout.)
- type of floor (Each ramp should remain in the same location throughout.)
- position of the stack of blocks or books where the height (H) is measured (at the same place under the ramp)
- method of releasing the car (The back wheels should be placed on the starting line and the car should be released gently without being pushed. Do not use spring-loaded cars.)
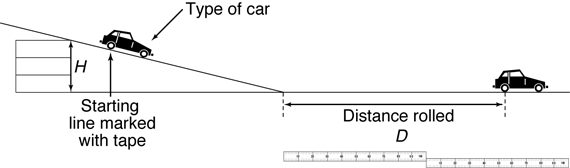
- how far the starting line is from the bottom of the ramp (Before students collect the data, the starting line can be adjusted so that the car rolls a reasonable amount. Then, it should be marked with tape.)
- how the distance rolled (D) is measured (from the bottom of the ramp to the back wheel of the car)
In Question 4, students discuss the advantages of running multiple trials in an experiment.
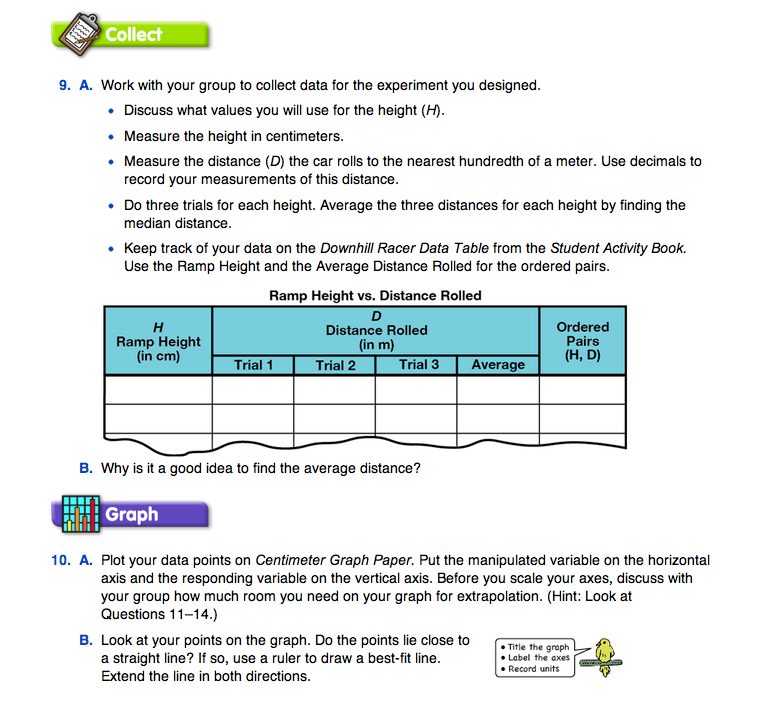
Use Question 5 to discuss how students are expected to measure distance in this investigation. Use the investigation setup and some metersticks to demonstrate Jackie's trial and help students show how far the car traveled in meters.
Ask:
Give students another example, saying that Jackie's car traveled two meters and stopped at 48 on the third meterstick.
Ask:

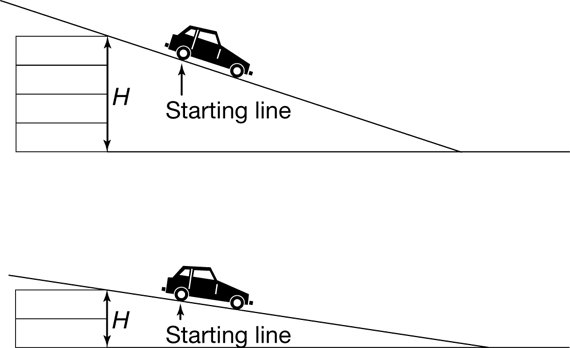
Identify Manipulated and Responding Variables. The manipulated variable (Question 6) is the variable with values selected at the beginning of the experiment. In this lab it is the height of the ramp (H). Either you select the heights or let the students select them. In any case, the values should be chosen so that a car will roll a reasonable distance, yet not roll too far. Try out different heights using different numbers of books or blocks that are the same thickness. The values should be well-spaced for easy graphing and preferably in some proportional pattern. Values like H = 4 cm, 8 cm, 16 cm or H = 8 cm, 16 cm, 24 cm work well. For example, you could use 1, 2, and 4 geography books or 2, 4, and 6 spelling books to get the desired heights in cm.
The responding variable (Question 7) is the variable with values found during the experiment. Here, it is the distance the car rolls on the floor (D). After the car stops, students should measure the distance from the bottom edge of the ramp to the rear wheels of the car, as shown in Figure 3. This distance should be measured to the nearest hundredth of a meter and expressed using decimals.
Draw Pictures. After you have discussed the lab and students understand the procedures, they draw pictures of the investigation (Question 8A). Emphasize that a good picture shows the equipment, identifies the variables, and communicates the procedures.
Tell students to use the list of fixed variables discussed in Questions 2 and 3 as a reference while drawing their pictures. Students' pictures can help you judge who is ready to go on to the next phase—collecting data. The picture in Figure 4 shows the experimental setup and the two main variables labeled H and D. However, it does not clearly show the method for measuring the distance—from the end of the ramp to the rear wheels—or show which variables are fixed.
Set Up the Ramps. Before students start to collect data, they should use their pictures to assemble the ramps and then test their setup. Ideally, the car should roll at least two meters when started at the maximum height, so students should try a variety of starting points before they begin to gather their data. They may notice that if they start at the top of the ramp, the car rolls too far or takes a bad roll. Students should make a mark on the ramp with a piece of masking tape so that the starting point is the same each time. Students should also make additional notes on their pictures and write a paragraph (Question 8B) to describe their setup as precisely as possible so later they can check their predictions by using exactly the same setup.