


Predictions from Graphs
Est. Class Sessions: 2Summarizing the Lesson
Assign each group of two or three students one graph from Questions 1–7 on the Using Best-Fit Lines pages in the Student Activity Book. Ask each group to discuss its assigned graph and answer Question 8.
Ask students to consider the following questions as they complete their work.
Provide a simple example, so that students have a good understanding of what they are looking for in analyzing their graphs.
For example, a graph of saving a penny a day would allow for exact prediction (i.e., it would be possible to predict with certainty just how much money has accrued by the 10th birthday). It would not make sense to extend the graph much beyond 100 years because people don't generally live past 100 years.
As you circulate and listen to conversations, help students get started by asking:
Have student groups report on their discussions and explain their reasoning when answering the questions. Encourage other students to ask questions or to offer their own opinions.
Reinforce the words interpolate and extrapolate by using them during the class discussion. Remind students of the clues they discussed earlier in the lesson to help them distinguish between the two words and remember their meanings.
Possible answers include:
- Q# 1 Graph:
- Nila's number of sit-ups will probably increase as she gets older, but it will level off eventually. Adults do not continue to increase their abilities at the same rate as they age.
- Q# 2 Graph:
- John's running time is decreasing as John gets older, but this pattern cannot go on indefinitely because very small running times are impossible.
- Q# 3 Graph:
- There are only 12 possible birth months, so it does not make sense to extend this graph.
- Q# 4 and 5 Graphs:
- This graph can go on almost indefinitely. The more cookies there are, the more the mass.
- Q# 6 Graph:
- You can continue the graph for a while and it would level off at about 50 cm. This shows people's heads stop growing at about 50 cm. But the graph cannot go on forever because people do not live forever.
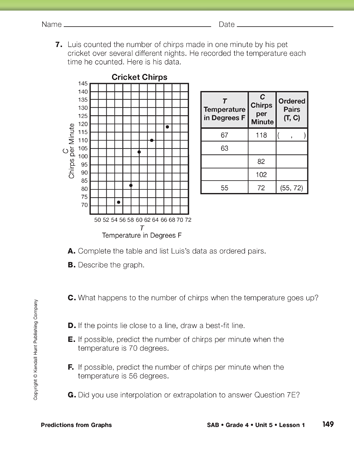
- Q# 7 Graph:
- This graph cannot go on indefinitely because at very high temperatures, living organisms die. Extending the temperature in the other direction may seem reasonable to students, but as a point of fact from scientific studies, crickets stop chirping when the temperature goes below about 55 degrees Fahrenheit.
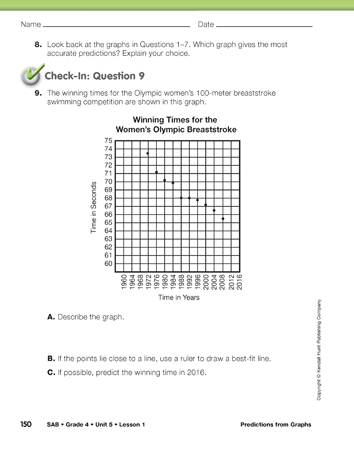
After students have completed their discussions, assign Check-In: Question 9 in the Student Activity Book. Ask students to complete this page independently.