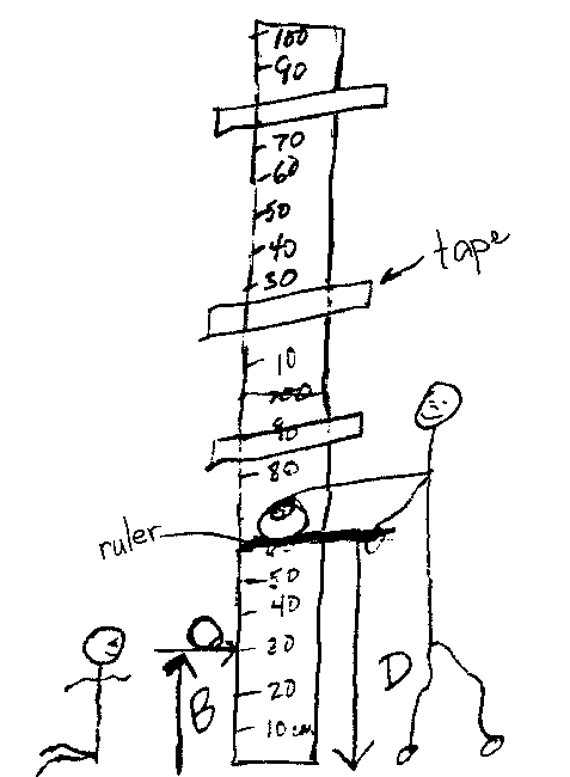
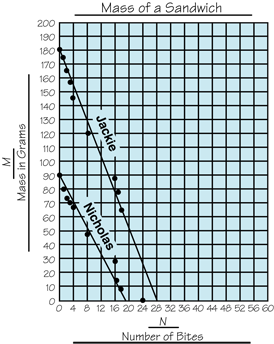
Students use the TIMS Laboratory Method to investigate the relationship between the drop height and bounce height of a tennis ball and a SuperBall®. Students drop each ball from three different heights and record the bounce height. Students then analyze that data represented in graphs and tables to make predictions and generalizations.
Content in this Lesson
- Using multiplication reasoning.
- Identifying manipulated and responding variables in an experiment.
- Collecting and organizing data in a table [E2].
- Making point graphs [E3].
- Drawing best-fit lines [E4].
- Finding the median and mean of a data set [E5, E6].
- Making predictions and generalizations using tables and graphs [E7].
- Measuring length in centimeters [E9].
- Identifying and extending patterns [E10].
- Using models to analyze mathematical relationships.
Assessment in this Lesson
| Assessment | Expectation Assessed | Math Practices Expectation Assessed |
|---|---|---|
|
Bouncing Ball |
|
|
|
DPP Item R |
|


