


The Meaning of the Mean
Est. Class Sessions: 2–3Developing the Lesson
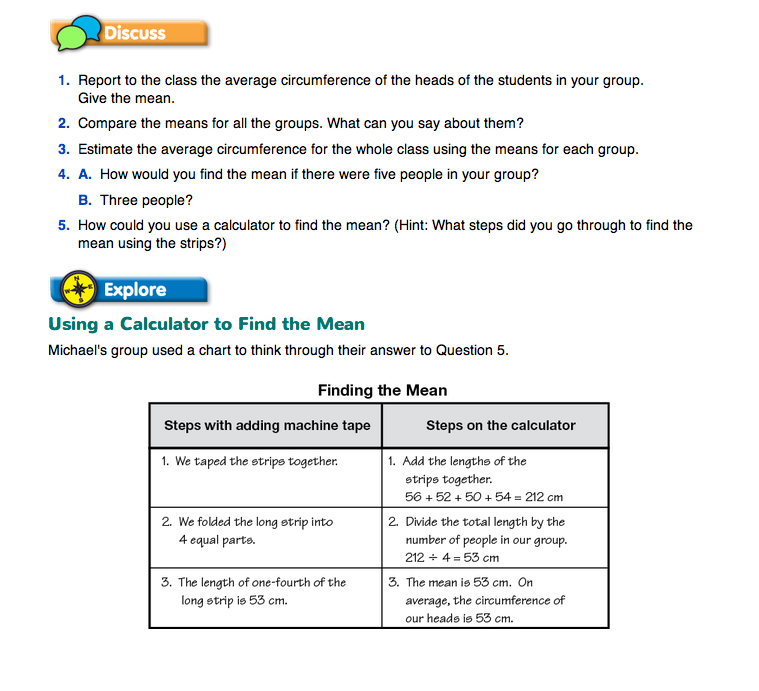
Part 2. Using a Calculator to Find the Mean Steps on the Calculator
Steps on the Calculator. Questions 4–5 lead students toward developing a procedure for finding means using a calculator. These steps are explained in the Using a Calculator to Find the Mean section of The Meaning of the Mean pages.
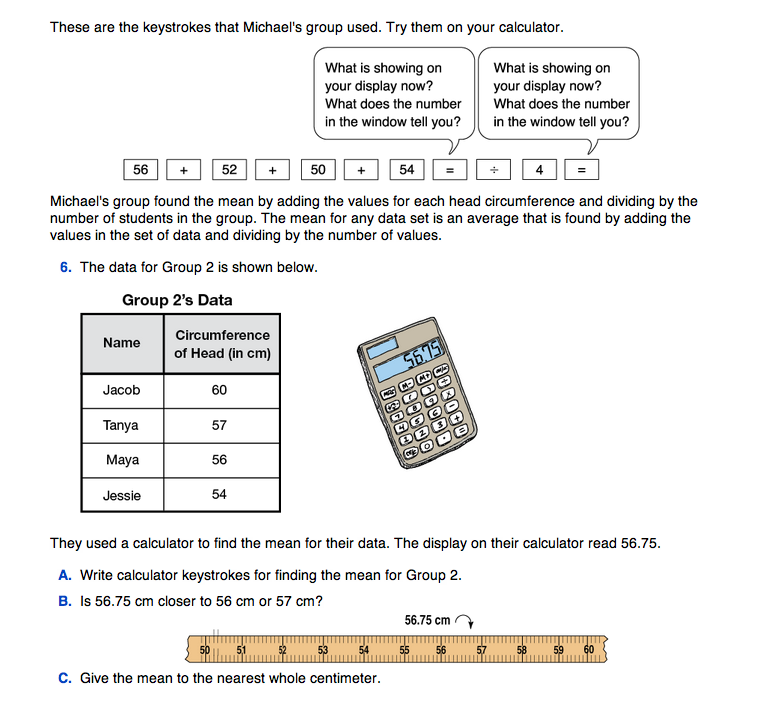
As students try the calculator strokes in the example, show them how to use the clear entry key on their calculators. (This key is often labeled CE/C.) If students make a mistake entering data, they can correct the last entry by pushing the clear entry key and then entering the correct data. By using this key, they will not have to reenter all of the data if they make a mistake adding many numbers.
Decimals on the Calculator. When students use calculators to find means, decimal answers are inevitable. Since the measurements were recorded to the nearest centimeter, the means should be given to the nearest centimeter as well. Question 6A asks students to give calculator strokes for finding the mean of 60 cm, 57 cm, 56 cm, and 54 cm. This may be the first time students record the calculator strokes, so you may need to model this. They can use the strokes shown in the Student Guide as an example. Then, Question 6B asks if the number on the display, 56.75, is closer to 56 cm or 57 cm. One way students can decide is by locating 56.75 cm on a meterstick and finding that 56.75 cm is closer to 57 cm. Another method is to ask them if $56.75 is closer to $56 or $57.
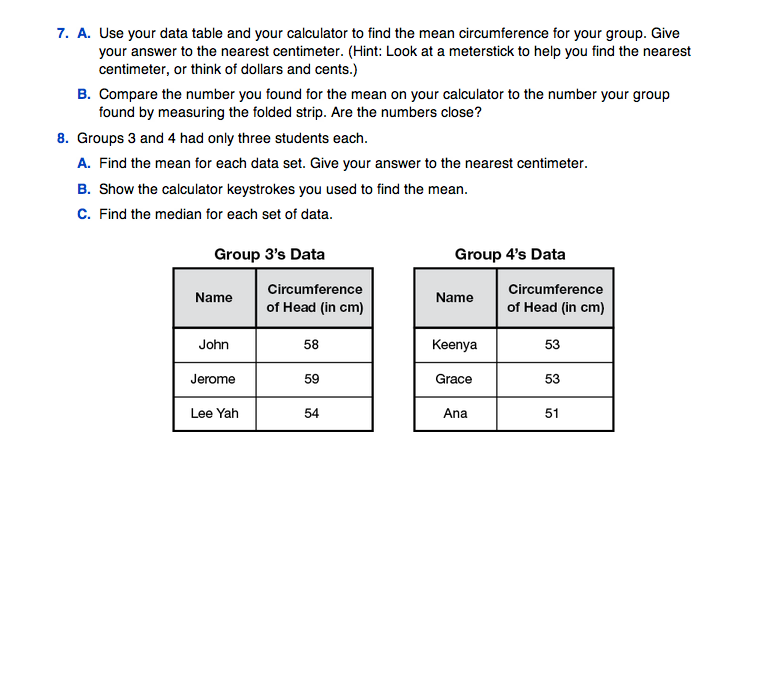
Question 7 asks each group to find the mean head circumference for the group using their data table and a calculator. Then, the group compares this answer to the number they found for the mean when they measured the folded strip. These numbers should be within one or two centimeters. If a group adds the numbers, but does not divide by the number of students in the group, remind them of our definition of an average: a number that will represent what is normal or typical for the group. Demonstrate by holding a group's long strip as if it were going around a giant's head.
Ask:
Question 8 provides practice in finding means with a calculator and finding medians without using towers of cubes.
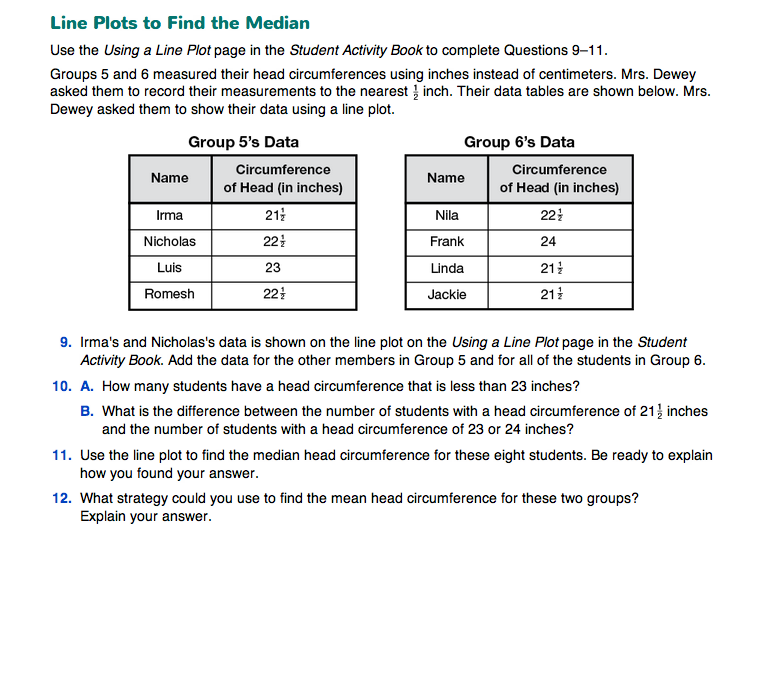
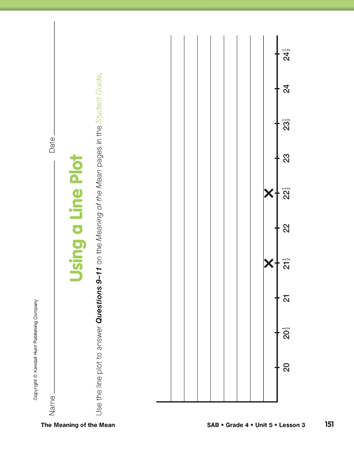
Using Line Plots to find the Median. Before students answer Questions 9–12, read the short vignette in the Student Guide. In this vignette, students are given a scenario in which two groups of students in Mrs. Dewey's class used inches instead of centimeters to find the circumference of their heads. Students will use the line plot on the Using a Line Plot page in the Student Activity Book to complete Question 9. After plotting the data, students use the line plot to answer Questions 10 and 11.
In Question 12, students are asked to find a strategy for finding the mean for the two groups. Since there are fractions involved, students may have some difficulty with this. Guiding the discussion with the following discussion prompts may help them answer this question.
Ask:
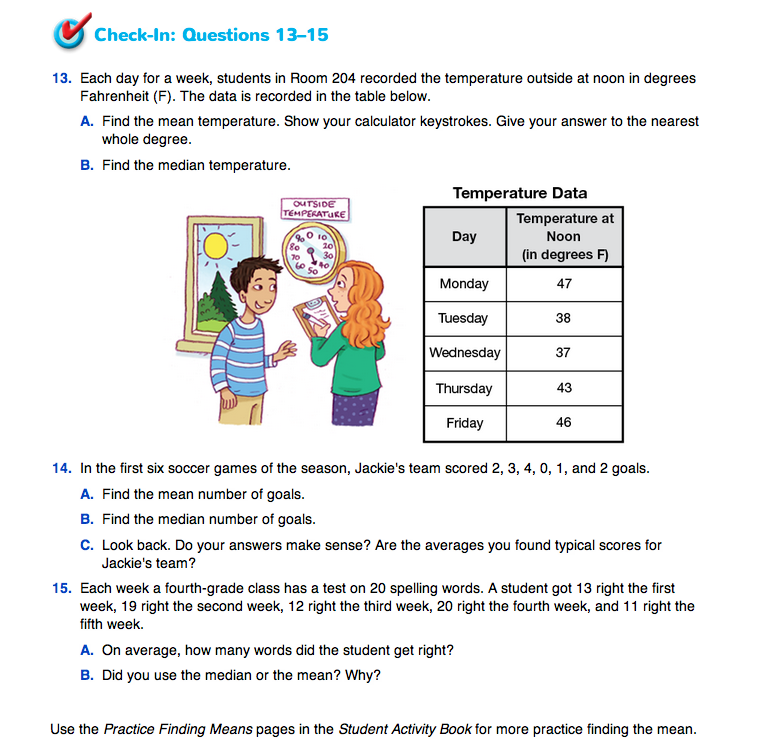
Ask students to work independently to complete Check-In: Questions 13–15.