


Using Data to Predict
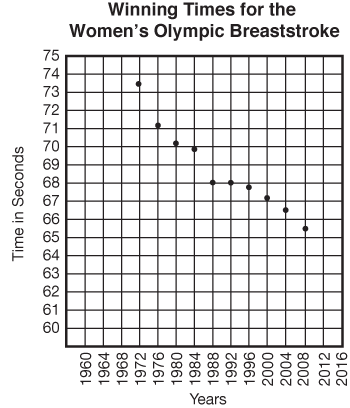
In this unit, students use data from different sources to make predictions. For example, using a graph from past Olympics and studying the patterns in the data, they make predictions about contests in future Olympics. See Figure 1. Several new ideas are introduced that help students become more sophisticated in their skills with data collection and analysis. These concepts and skills are closely connected to other areas of mathematics including measurement and algebra.
Historically, algebra has been seen as something that goes on in middle grades and high school. Some students do well and others cannot seem to get it. For many, algebra is seen as following a mysterious set of rules to move x's and y's around on paper. The equation
has little meaning to many algebra students, but they are asked to graph and interpret it, seemingly without purpose in the real world.
These students then steer away from learning more math and science. As a consequence, they are filtered out of fields that require this knowledge, such as medicine, engineering, and environmental policy.
Algebra in the Elementary Grades
Following the recommendations of researchers, Math Trailblazers includes activities in all… read more
Algebra in the Elementary Grades
Following the recommendations of researchers, Math Trailblazers includes activities in all grades that give students concepts and skills needed to make a natural transition from learning and doing arithmetic to learning and doing algebra. Students extend and connect their concepts of number, geometry, measurement, and data to develop tools for algebraic reasoning. These tools enable them to “do algebra,” that is, to identify, describe, visualize, and simplify patterns and relationships. They learn to generalize procedures they use for arithmetic. They also make generalizations about numbers that are collected in data sets, organized in tables, and pictured in graphs.
In Lesson 1, students further explore the use of best-fit lines to make predictions from graphs as shown in Figure 1. In Lessons 2 and 3, they review the use of medians as averages and learn to find another average, the mean. They use the averages to make predictions and generalizations about data sets.
The Bouncing Ball lab in Lesson 4 is the centerpiece of the unit and integrates many of the skills and concepts in number, measurement, and data that students have learned in previous units and grades and extends them using algebraic reasoning. In the lab, students look for the relationship between bounce heights and drop heights of balls. Following the steps of the TIMS Laboratory Method, students first represent the variables and procedures in the lab in a drawing and label them with symbols: D for Drop Height and B for Bounce Height. They collect the data by dropping balls from various heights and measuring the bounce height, organize the data in a table, and display it in a graph.
Figures 2 and 3 show sample data for tennis balls. Students use their data tables and graphs to make predictions. They make generalizations about the data and the relationships between the two main variables—the Bounce Height (B) of the tennis ball is about half the Drop Height (D).


Students continue to refine and apply their prediction and generalization skills in Lesson 5 Workshop: Patterns and Lesson 7 Professor Peabody Invents a Ball. These lessons provide a purpose for using the tools of algebra in settings students understand.
Lesson 6 Function Machines extends students' abilities to identify and describe patterns using tables and words to include the use of symbols to represent mathematical relationships. Functions are important mathematical relationships studied extensively in algebra. They can be considered rules that assign a unique output number to every input number. For example, Figure 4 shows a data table that represents a Doubling Machine with input and output numbers. The last row shows a way to represent the rule in symbols.

The function machines are connected to the previous lessons with the data table shown in Figure 5. Students build a two-column data table using points from a best-fit line of sample data from the Bouncing Ball lab. Students can generalize the rule in words, “The Bounce Height is half of the Drop Height” and represent it using variables, “B = D ÷ 2.” They can use the rule to make predictions about any Bounce Height given a Drop Height. For example, a ball dropped from 200 cm will bounce 100 cm because 100 = 200 ÷ 2.

Being able to make predictions and generalizations using these tools exemplifies the power of algebraic reasoning that elementary students can do. Note that the relationship in the Bouncing Ball data can be written as
This is essentially the same equation as our original example
In this case, students develop meaning and purpose for its use.
MATH FACTS and MENTAL MATH

This unit continues the review and assessment of the multiplication facts to develop mental math… read more
This unit continues the review and assessment of the multiplication facts to develop mental math strategies, gain proficiency, and to learn to apply multiplication strategies to larger numbers. Students will focus on the last six multiplication facts (4 × 6, 4 × 7, 4 × 8, 6 × 7, 6 × 8, 7 × 8).
Resources
- Carpenter, T.P., M.L. Franke, and L. Levi. Thinking Mathematically. Heinemann, Portsmouth, NH, 2003.
- Carraher, D.W. and A.D. Schliemann. “Early Algebra.” F.K. Lester, Jr., ed. In Second Handbook of Research on Mathematics Teaching and Learning. Information Age Publishing, Inc., Charlotte, NC, 2007.
- Kaput, J.J. Algebra in the Early Grades. Lawrence Erlbaum Associates, New York, NY, 2008.
- Kilpatrick, J. and A. Izsak. “A History of Algebra in the School Curriculum.” C.E. Greens and R. Rubenstein, eds. Algebra and Algebraic Thinking in School Mathematics. The National Council of Teachers of Mathematics, Reston, VA, 2008.
- National Research Council. “Developing Proficiency With Whole Numbers.” In Adding It Up: Helping Children Learn Mathematics. J. Kilpatrick, J. Swafford, and B. Findell, eds. National Academy Press, Washington, DC, 2001.
- Principles and Standards for School Mathematics. The National Council of Teachers of Mathematics, Reston, VA, 2000.
- Schliemann, A.D., D.W. Carraher, and B.M. Brizuela. Bringing Out the Algebraic Character of Arithmetic. Lawrence Erlbaum Associates, Mahwah, NJ, 2007.