Lesson 1

Predictions from Graphs

Est. Class Sessions: 2
X

Mathematical Standards

4.NBT.A
Generalize place value understanding for multi-digit whole numbers. (4.NBT.A.3)

Standards for Mathematical Practice

MP1.
Make sense of problems and persevere in solving them.
MP4.
Model with mathematics.
MP7.
Look for and make use of structure.

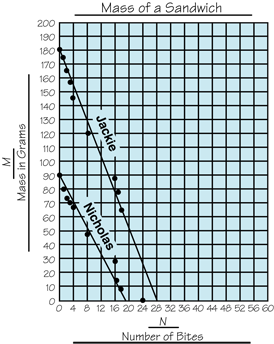
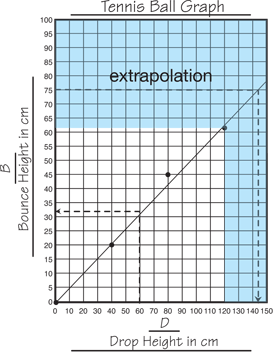
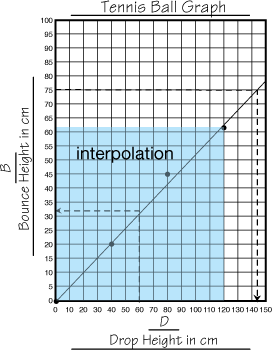
Students look for patterns and make predictions using graphs. They then practice drawing best-fit lines and making predictions.

Content in this Lesson

  • Interpreting point graphs [E7].
  • Drawing best-fit lines [E4].
  • Making predictions and generalizations about a data set using data tables and graphs [E7].
  • Demonstrating proficiency with the last six multiplication facts [E12].
X

Materials for Students

Daily Practice and Problems Lesson Homework Assessment

Student Books

Student Guide
Student Activity Book

Teacher Resources

Teacher Guide - digital

Supplies for Students

ruler
string or uncooked spaghetti, optional

Materials for the Teacher

Display of Olympic Long Jump Master (Teacher Guide)
Display of Mile Run Master (Teacher Guide)
Display of Nila's Sit-Ups Master (Teacher Guide)
Unit 5 Assessment Record
Math Facts Class Record

Materials Preparation

Triangle Flash Cards. Prepare copies of the Triangle Flash Cards on heavier paper or card stock. Have students cut apart each set and store them in an envelope. You may want to provide each student with two sets, one to use at school and one to take home.

Assessment in this Lesson

Assessment Expectation Assessed

Using Best-Fit Lines
Check-In: Question 9
Student Activity Book
Page 150

E4.
Draw a best-fit line.
E7.
Make predictions and generalizations using tables and graphs.

DPP Item A
Triangle Flash Cards: Last Six Facts
Teacher Guide - digital

E12.
Demonstrate fluency with the last six multiplication facts (4 × 6, 4 × 7, 4 × 8, 6 × 7, 6 × 8, 7 × 8).

Vocabulary in this Lesson