Manipulated, Responding, and Fixed Variables. In simple experiments, students look for the relationship between two main variables. We call these two variables the manipulated variable and the responding variable. These variables are also commonly called the independent and dependent variables. After many years of working with students on identification of variables, we have found the terms manipulated and responding to be less confusing than independent and dependent. However, the important idea is for students to understand that as we change the values for the manipulated variable, we look for a corresponding change (a response) in the values of the responding variable.
The idea of controlled, or fixed, variables in an investigation is also very important. In this lab, students change the drop heights and look for corresponding changes in the bounce heights. They try to keep the other variables—type of ball, type of floor, and method of release—constant. That way, if they observe differences in bounce height, they can say with some certainty that the change was probably caused by the change in drop height.
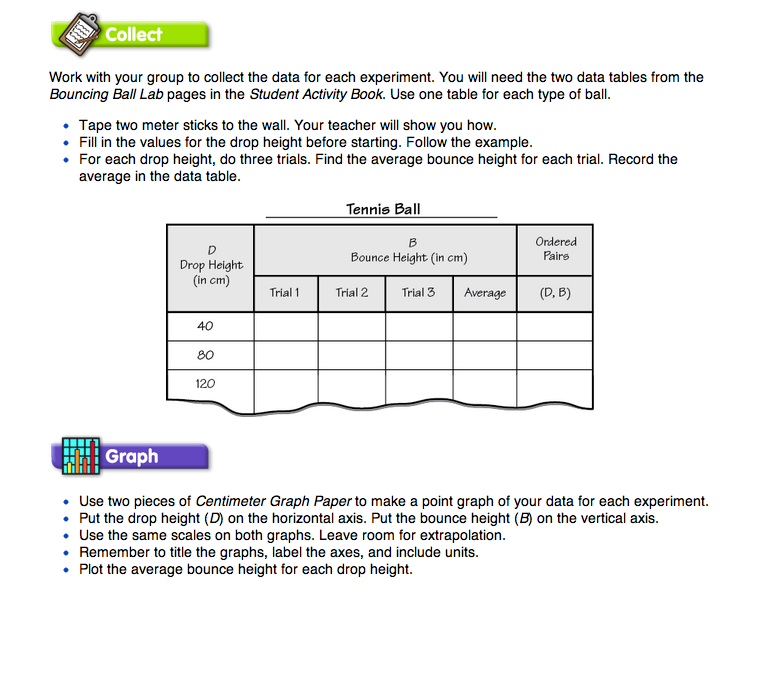
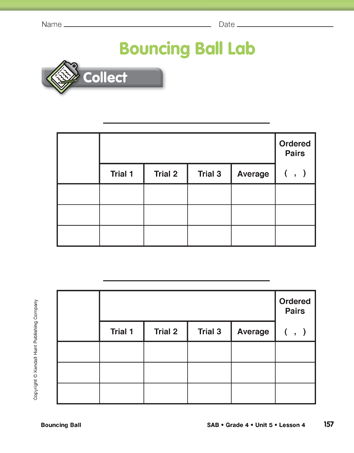
Review Fixed Variables. Students will use the two data tables in the Bouncing Ball Lab page in the Student Activity Book to collect and organize their data. One of the data tables will be used for the tennis ball and one for the SuperBall®. Students may use the Collect section of the Bouncing Ball pages in the Student Guide as a guide for setting up their data tables.
Three students per group works well in this investigation—one student can drop the ball; one can read the bounce height; and one can record the data. After students have set up their data tables, but before they begin collecting their data, use the following questions to review the variables that need to be fixed in this investigation.
- How should you drop the ball for each of the trials? (Just release the ball. Do not throw it down.)
- How should you measure the drop height and the bounce height? (We should measure both the drop height and the bounce height from the bottom of the ball.)
- What strategies can you use to help you measure the drop height and bounce height? (The person who is dropping the ball or the recorder can hold a ruler at the drop height to make sure the bottom of the ball is at the right height before it is dropped. The person who is measuring the bounce height needs to kneel down so when the ball bounces back up it will be easier to read the meterstick and estimate the bounce height.)
- How many trials should you do at each drop height for each of the balls? (We need to do three trials for each of the balls.)
- Why is it a good idea to do three trials at each drop height for each of the balls? (When we drop the ball and it bounces back, it will not be the same each time but it should be close. If it is close we can be pretty sure that we are doing the experiment correctly.)
What's Close? In an experiment with multiple trials, we expect repeated trials to give measurements that are “close.” If one of the trials is not close to the others, we suspect that error was involved and we should repeat that trial.
One difficulty in determining whether to repeat a trial is that “close” is not a precise mathematical term. It depends on the size of the numbers involved. For example, if you measure the length of your school's playground and are off by a few inches, or even a few feet, you would probably consider that your measurement is close. However, if you measure the length of a pencil and you are off by a few inches, your measurement is not close. Closeness also depends on the procedures and equipment you use in making your measurements. For example, if you use elaborate video equipment to measure bounce height in the Bouncing Ball experiment, you would expect your trials to be closer than if you measure with “the naked eye” as described in this lesson.
When deciding what to accept as close in an experiment, students should take several practice trials to get a feeling of what to expect. Encourage them to talk about what is reasonable data and to repeat trials that give data that does not seem reasonable.
Measure the Bounce Height. Ask students to practice measuring several bounces so each person can practice his or her job in their group and so they can get a feel for the proper range of data. This will also give you an opportunity to make sure each group understands the procedure for dropping the ball and for measuring drop height and bounce height. Students may ask how closely they need to measure the bounce height. Since the ball is moving they should practice measuring the bounce height to the nearest centimeter.
Once students understand their roles and are comfortable with measuring both the drop and bounce heights, display the Bouncing Ball Data: What's Wrong Here? Master.
Ask the students to work with their group to answer the following questions.
- Look at the first data table on this page. What do you notice about each the trials for each of the drop heights? (They are the same for each one of the trials.)
- How do you know that this is probably not accurate? (The bounce heights should be close but it is not likely that they would be exactly the same for all the trials at the different drop heights.)
- Look at the second data table; what do you notice about the data on this table? (The data for the drop heights of 40 cm and 80 cm look like they are accurate. The bounce heights are close but not exactly the same. But the data for the second trial for the bounce height of 120 cm is a lot different than the data for the first and third trials. It looks like that could be a mistake.)
- If your group gets a bounce height measurement that does not seem close to the other trials what should you do? (We should do that trial over again to see if we can get a more accurate measurement.)
- Look at the column of the second data table that is titled Average. What are two ways that you could use to find the average of the three trials? (mean or median)
- Look at the second data table. Which average, the mean or the median, is shown? (mean) How do you know? (It has to be the mean because the median would be the middle number and it isn't.)
- How does the value of 91 cm affect the mean? (The measurement of 91 cm raises the average, so that it is greater than the other two values.)
Collect Bounce Height Data. Students are now ready to collect the bounce height data. Each group should use the same ball for all trials and predictions. Each ball should be numbered so that groups can find their balls to make predictions or finish collecting data on succeeding days of the experiment.
After completing three trials at each bounce height for both the tennis ball and the SuperBall®, students will find the average of each of the three trials and record it in the data table. The mean or the median can be used to find the average. If students find the mean they can use a calculator, but encourage them to give the mean to the nearest whole centimeter.
Sample data tables for both the tennis ball and SuperBall® experiments are shown in Figure 3. The averages are the means of the three trials for each drop height. To avoid confusion, students should indicate on their data tables which average they used.
Use students' data tables and the Bouncing Ball Feedback Box Assessment Master to assess their abilities to collect and organize data in a table [E2]; measure lengths in centimeters [E9]; find the median or mean of a data set [E5, E6].
Students complete their data tables by writing ordered pairs in the last column to show the points they will graph: (Drop Height, Average Bounce Height).