


Function Machines
Est. Class Sessions: 2–3Summarizing the Lesson
Conclude this lesson by making the connection between function machines and the previous lessons in the unit using Question 9 in the Student Activity Book.
Functions are used to describe the relationship between variables. The input is the manipulated variable and the output is the responding variable. For example, in the Bouncing Ball experiment, the input number is the Drop Height and the output number is the Bounce Height.
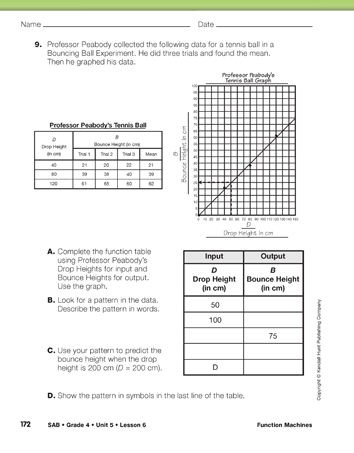
Question 9 asks students to complete a data table by using the best-fit line on a graph of Professor Peabody's Bouncing Ball data.
Ask:
The data should be similar to the data the students collected. Ask them to complete the table in Question 9A by interpolating on the graph. Students can start by using the dotted line shown on the graph for finding the bounce height for a drop height of 50 cm. By completing Questions 9B and 9C, students can observe that the Bounce Height is half the Drop Height—the function machine is a halving machine. They can express this rule in symbols by writing B = D ÷ 2. (This can also be expressed as B = 1/2 × D.) Using this information, students can predict the Bounce Height will be 100 cm when the Drop Height is 200 cm (Question 9D).
Assign the Function Tables Homework section in the Student Activity Book.